Map Administration
The Map Administration section allows the administrator to customize enlighten’s mapping functionalities.
The Map Administration functionalities are arranged in the following groups:
- Show Info: Customize the information you want to appear in report forms using advanced features.
- Relationships: Maintain relationship linkages within the spatial and attribute tables.
- Lookups: Maintain links to lookup tables.
- Search: Manage searches to the system.
- Search Group: Maintain searches order.
- Layer Filter: Maintain layer filters to the system.
- enFact: Configuration of geo-locating corporate artifacts.
- Network Trace: Modify the layers to be referenced by the network trace function.
- Redline Layers: Modify the redline layers defined by the system.
- enPlot: Create and maintain plot applications.
- enCapture: Create and maintain enCapture tables. (Separate documentation.)
- Selections: Maintain selections to the system.
- Mail Merge: Specify the location of the document template to be used by the Mail Merge function.
- Publish Layers and Forms: Update the enlighten database with the latest layer information from your map definition.
- Integration: Maintain integration module and function information.
- Property System Matching: Matching enlighten to third-party application.
 Show Info Pane
Show Info forms are used to view detailed information about items selected in the map view. You can tailor this information to the needs of your organization. Below is an example of a Show Info form as it would appear in Map View for selected map features.
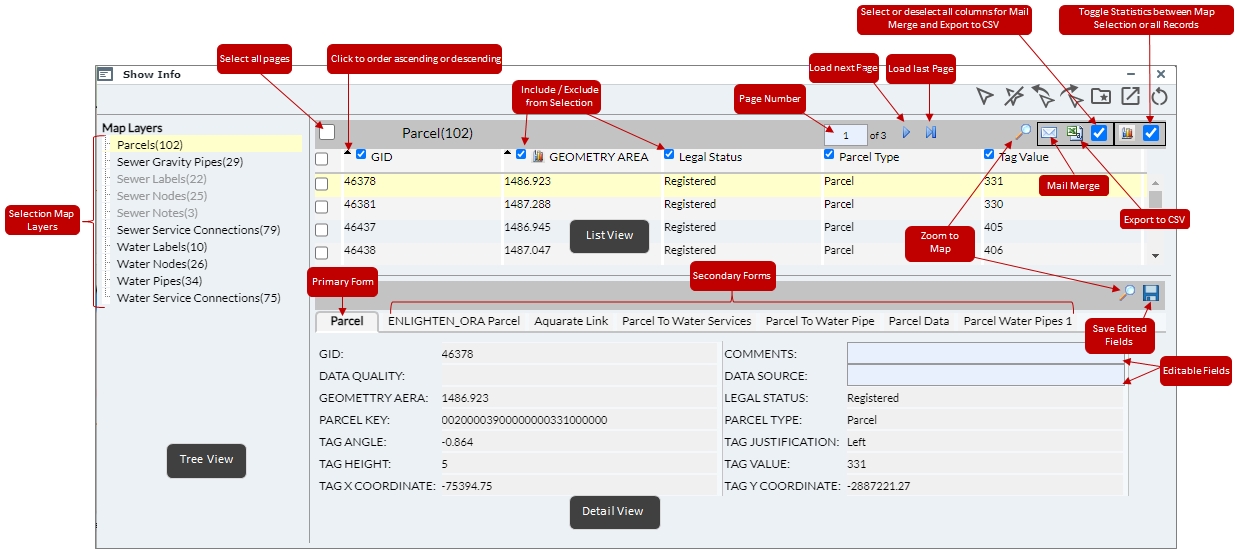
Fig: Map View of a Configured Show Info Form
Add Form
To setup a Show Info form the following steps can be followed:
- Navigate to Admin View > Map Administration > Show Info > Add Form.
- Define a Form Title: Enter a title that uniquely identifies the show info form in the text box Form Title.
- Define Spatial Data:
- Select the layer that the show info form will refer to from the Map Layer drop-down list.
- The Spatial Table and Spatial Primary key will be auto generated once a layer is selected.
- The Link Key is a column that joins the spatial table to the attribute table. A Join Key is found automatically when a relationship is setup and should not be changed.
- A primary form is the first form created and will be the first tab in the user environment. Its information is displayed in the list view and detail view when opening a show info form for the layer. A secondary form is an additional form, whose information will not be initially displayed, but is available by selecting the corresponding tab in the user environment. If other forms have already been created for this layer, their names will appear in the Primary Form and Secondary Forms headings at the top of the page.
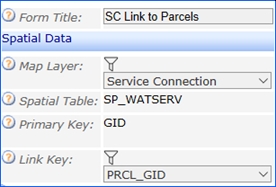
Fig: Add Show Info form
- Define Attribute Data: When two tables share a common column, it is possible to create a Show Info form where the attribute data is sourced from a different table or data source to that of the spatial information.
- Select a data source that contains the desired information.
- Select a table from which the columns can be extracted.
- Select a primary key that uniquely identifies the form details.
- Join key is a column that joins the attribute table to the spatial table.
E.g. by querying the Water Service Connection layer (Spatial Data), the Show Info Form can display information about the Parcel it is linked to SC Link to Parcels (Attribute Data). A relationship exists because the spatial table SP_WATSERV and the form table SP_PARCEL Link using the PRCL_GID and GID columns which acts as a join key.
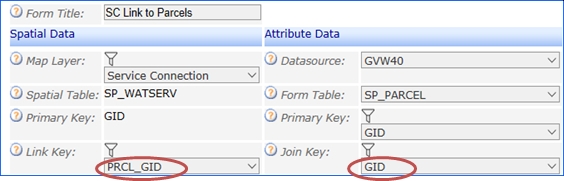
Fig: Show Info form with linked tablesFor more complex relationships (the joining of two or more tables) the relationship must be set up using Add Relationship. Show Info forms will then automatically detect the relationship and the Join key found will appear in the Link Key text box.
- Define List View: Filling out this section determines which columns from the selected attribute table will appear in the List View of the Show Info window in the map view. To do this follow the steps outlined below:
- Select an alternative list view: If the layer contains several Show Info forms, it is possible to select a List View of an alternative form to appear. This can be achieved by choosing another form from the Select an alternative list view drop-down box.
- Select All: Will select all the columns to be used with the Show Info form
- Where: A valid SQL WHERE clause or a function can be entered in the Where input box to filter the information in the List View.
- Mail Merge: Tick the Mail Merge box to activate the option of creating a mail merge document from the Show Info form.
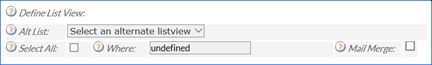
Fig: Define List View - Seq: Describes the sequence in which the columns will be displayed in the form.
- Select: Lists all column names associated with the Attribute Data. Columns that are ticked will display in the Show Info forms.
- Column: Columns available for display in the form.
- Conversion: Entering a conversion using SQL syntax, and defining the column to use for sorting (order) the form results.
- Heading: Describes the column headings to be used in the list view.
- Order By: Defines which columns will be used to sort the form.
- Column Statistics: See the section below.
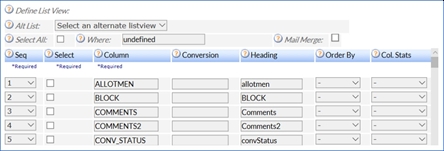
Fig: Column Statistics
- Column statistics: Are available for some data and can be defined as Ordinal or Analytical.
- Ordinal Statistics: Offers one output only, a count of each value found in the column. The tool will calculate the total of each possible value for all the data in the database.
This is similar to the SQL: SELECT 'COLUMN', COUNT (*) FROM 'TABLE' GROUP BY 'COLUMN'. This is useful not only to count distinctive values, but it may also assist in finding dirty data. This information can now easily be used to filter out those pipes where the type is null and to rectify the data.
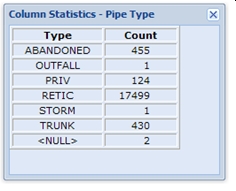
Fig: Ordinal Statistics in Map View - Analytical Statistics: are available for numeric columns. There are three types of analytical statistics:
- Analytical: Will show all the values in the database.
- Analytical-N: Will show all the values except for those that are null.
- Analytical-Z: Will show all the values except for those that are null or zero.
All the analytical statistics forms will show the:
- Sum: This is the mathematical total of all the values in the list view. If, as in the example, the statistic is calculated on the pipe length and you have selected a subset of your pipe network, this will, therefore, give you the total length of the selected network.
- Average: This is the mathematical average of all the values in the list view. In the pipe example, it, therefore, gives us the average pipe length.
- Min: This is the smallest value in the list view. In the example, this refers to the shortest pipe.
- Max: This is the largest value in the list view. In the example, this refers to the longest pipe.
- Median: This is the statistical mean of all the values in the list view. It is the middle value of all the available values sorted from high to low.
- Standard Deviation: This shows how much variation or dispersion there is from the average.
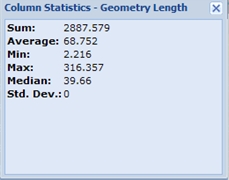
Fig: Analytical Statistics
- Define Detail View: : Filling out this section determines which columns from the selected layer attribute table will appear in the Detail View of the report information window in the map view.
- Select All: Will select all the columns to be used with the Show Info form.
- Where: A valid SQL WHERE clause or a function can be entered in the Where input box to filter the information in the List View.
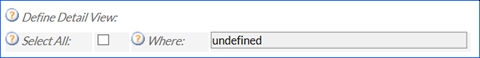
Fig: Define Detail View - Seq: Describes the sequence in which the columns will be displayed in the form.
- Select: Describes the columns to be displayed in the form.
- Column: Columns available for display in the form.
- Conversion: Entering a conversion using SQL syntax, and defining the column to use for sorting (order) the form results. This can also be used to add a prefix or suffix to a column value e.g. where the Parcel Area value is suffixed with an m2.
- Heading: Describes the column headings to be used in the list view. Allows you to enter a user defined column header value that better describes the column value, for example, the column GEOM_AREA can be displayed using the heading Parcel Area.
- Size: The size column is only required when the field is editable as it will limit the input of the user to the specified size.
- URL: The Detail View can be further customized by setting a URL for column values. This can be used, for example, to view Geo-scan images (.PDF file) linked to a Geo-scan boundary (Spatial object). In the example below, the URL is ticked for the Geo-scan Image File Name field IMG_FILENAME.
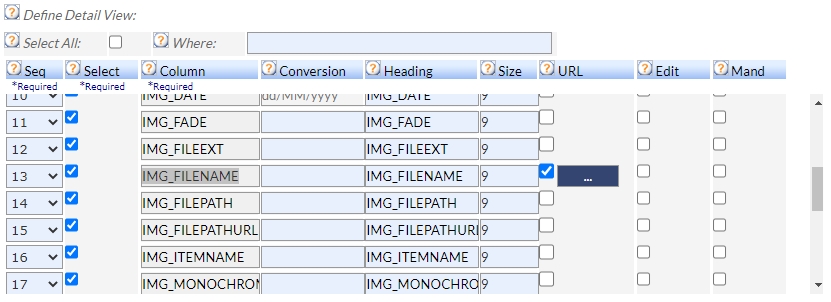
Fig: Enter URL Prefix/SuffixThe URL Prefix setting points to the location on the server where the Geo-scan images are saved, for example https://[servername]/images/Geoscan/, while the URL Suffix setting stores the file type so that the correct application associated to the file type is used to display the Image preview, for example .PDF
The option to Enable preview panel displays a preview of the attached image/document described in the URL location in a separate Image Preview box. The setting is an ON/OFF tick-box option, where if ticked, the Image Preview box is automatically displayed when Show Info is opened. The Image Preview box can be resized by dragging the Preview Image frame, or the original image/document can be viewed by selecting the View in full window button at the bottom of the Preview Image box.
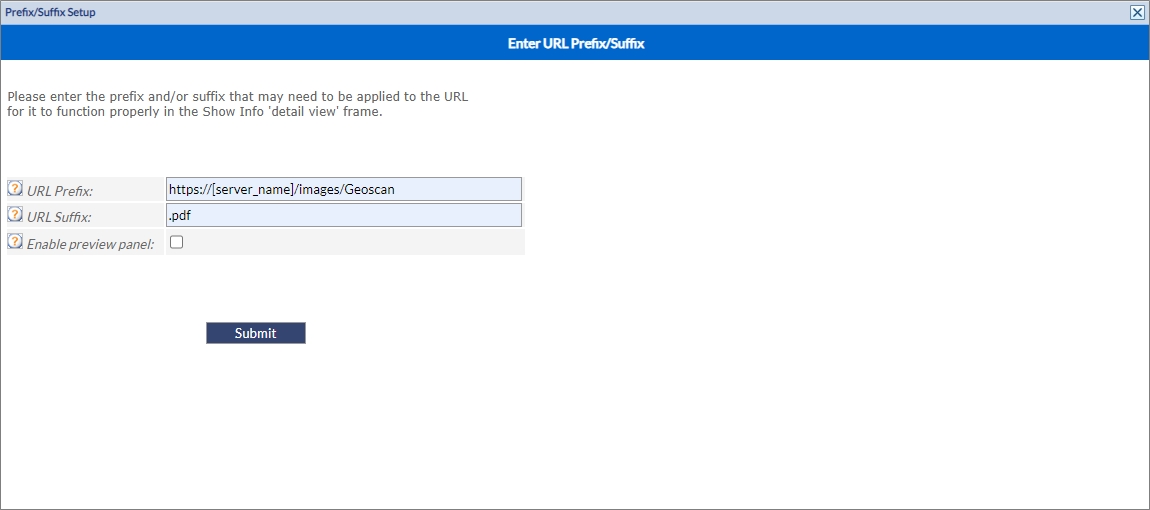
Fig: Enter URL Prefix/Suffix and Enable Image PreviewTo edit the URL prefix and suffix, open the Show Info editor and select the edit icon … in the Define Detail View of the Show Info Form Editor.
- Edit: Allows the user to edit the results in the detail view. Please see the case study on editing show info forms.
Note: The Administrator must first set the permission for a user to be able to edit the attribute value of an object, have permission to the layer and have permission to the function. In addition, there are some database settings that need to be changed to enable editing. In the EN_SETTINGS table, REPORT_DETEDIT and REPORT_UPDATES values should be set to YES for allow editing and saving the changes. - Mand: If a field is editable you can set it to mandatory, it means that the record cannot be saved unless the mandatory fields have data entered. However, some attribute values cannot be altered (E.g. GID) and therefore the corresponding Edit and Mand check-boxes will appear greyed out.
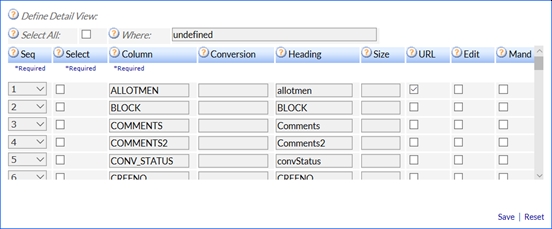
Fig: Detail View Settings
- Click the Save button to save the Show Info form.
Note: You can set the preference for the Show Info button to launch Show Info forms. The number of records returned per Show Info form page is setup in the Admin View > Site Settings > Configure Settings > Show Info > REPORT_MAXROWS. A minimum value of 20 is required and the maximum value of characters is 250.
Edit or Delete a Form
Within Show Info > Edit/Delete Form, the user has the option to Order, Edit and Delete forms. These functions are simplified below:
- Order: This function allows the administrator to change the order in which the Show Info forms will appear in the detail view, if there is more than one form setup for that particular layer.
- Edit: This feature allows the administrator to implement changes to the Show Info form where required, either adding on more columns for information to be returned or adjusting column sizes.
- Delete: This allows the enlighten Administrator to delete a particular form that is setup for a specific reason, if it becomes obsolete unnecessary.
To edit a Show Info form the following steps can be followed:
- Navigate to Admin View > Map Administration > Show Info > Edit/Delete Form.
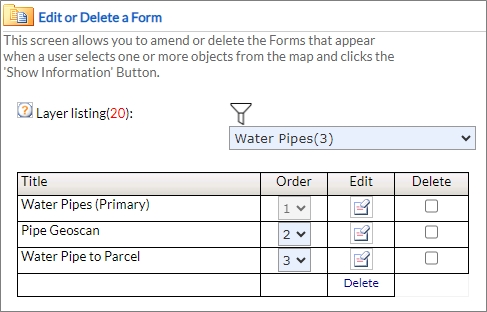
Fig: Edit or Delete a Form - Select the layer from the Layer listing drop down.
- To edit a form select the Edit button next to the form.
This will open the form as seen when adding the information. Changes can be made and saved in this view.
- To delete a form, select the checkbox next to the form and click the Delete button.
Relationships
Once a relationship is set up it will allow you to display attributes of indirectly related tables in applications such as:
- Show Info forms.
- Integrations.
- Searches / Plot Applications.
This function allows the relationship linkages within the spatial and attribute tables. To display attribute information from a table that does not share a common column (Key) an intermediate table is used that shares columns (Keys) from the tables in question.
See the Relationships Case Study for more details.
Relationships also allow dynamic filtering on certain fields which is hard-coded into the system. These dynamic filters will only become visible if the count of the list is greater than 20. The user can then easily search for and navigate to the desired feature from the list.
Add Relationship
To add a relationship the following steps can be followed:
- Navigate to Admin View > Map Administration > Relationships.
- Select Add a Relationship from the List drop-down menu.
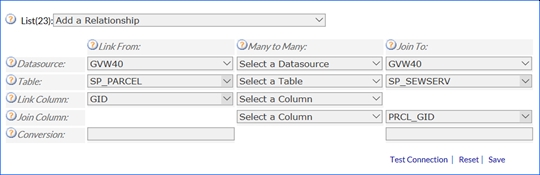
Fig: Add a Relationship - Define the Relationship:
- Link From: defines the table from which the link is established.
- Many to Many: (optional) defines the table acting as an intermediary for the link/join tables.
- Join to: defines the table to join with.
- To test the relationship use one of the following options:
- Conversion: Uses SQL syntax to filter out the data.
- Test Connection: Testing that the linkage between tables is functioning correctly.
- Select Test Connection to test the relationship.
- A Successful Test Connection message
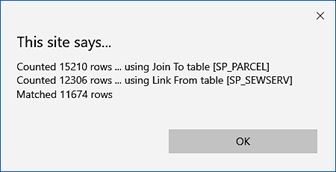
Fig: Successful Table Relationship connection - A Failed Test Connection message
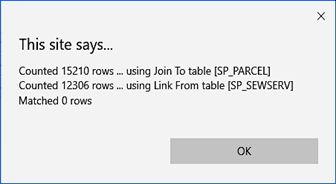
Fig: Failed Table Relationship connection
- A Successful Test Connection message
- Click the Save button to save the relationship
Edit Relationship
To edit a relationship the following steps can be followed:
- Navigate to Admin View > Map Administration > Relationships.
- Select the Relationship to edit from the List drop-down menu.
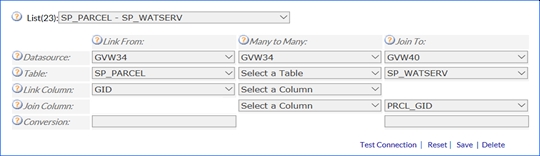
Fig: Edit a Relationship - Make changes within the respective fields.
- Test the relationship by selecting the Test Connection button.
- Save the relationship by clicking the Save button.
Delete Relationship
To delete a relationship the following steps can be followed:
- Navigate to Admin View > Map Administration > Relationships.
- Select the Relationship to delete from the List drop-down menu.
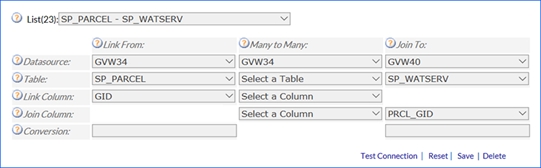
Fig: Delete a Relationship - Click on the Delete button to delete the relationship.
Lookups
From the Lookup menu, the administrator can add, edit and delete lookups. Lookups are links between database tables containing codes and tables containing codes and descriptions. Lookups are used in the Show Info form Detail View section and in Searches. If defined, it will translate codes into their associated descriptions. An example is a type of pipe material can be abbreviated as PVC but be displayed in the description as Polymer Vinyl Chloride.
Lookups also allow dynamic filtering on certain fields which is hard-coded into the system. These dynamic filters will only become visible if the count of the list is greater than 20. The user can then easily search for and navigate to the desired feature from the list.
Add a Lookup
To add a lookup the following steps can be followed:
- Navigate to Admin View > Map Administration > Lookups > Add a Lookup .
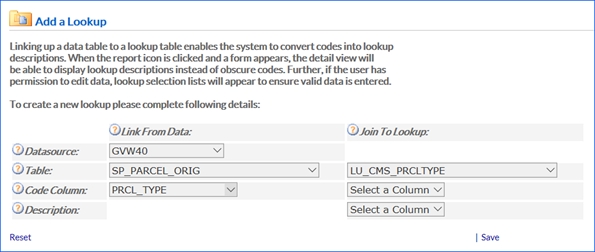
Fig: Add a Lookup - Define the lookup:
- Datasource: Select the relevant Datasource.
- Table: Define the tables that are to be joined.
- Code Columns: Define the table columns that will be joined.
- Description: Define the lookup description column that is to be returned.
By doing so, the PRCL_TYPE column of the SP_ PARCEL_ORIG table would be joined to the LCODE (lookup code) column of the lookup table. When querying the data, the returning value will be the code description that is stored in the LVALUE (lookup value) column. Please see the case study on adding a lookup.
Manage Lookup
To edit or delete a lookup the following steps can be followed:
- Navigate to Admin View > Map Administration > Lookups > Manage Lookups .
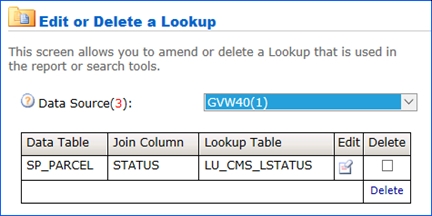
Fig: Edit or Delete a Lookup - Select the relevant data source for the Data Source drop-down list.
- To edit a lookup select Edit button next to the lookup.
This will open the lookup as seen when adding the information. Changes can be made and saved in this view.
- To delete a lookup, select the checkbox next to the lookup and click the Delete button.
Search
The Search Setup section of the Administrator View allows adding, editing, deleting and grouping custom searches. Searches will then be available from the Search menu in the Map View.
Add Search
To add a search the following steps can be followed:
- Navigate to Admin View > Map Administration > Search.
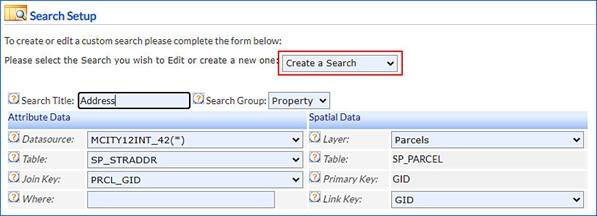
Fig: Search Setup - Select Create a Search form the drop-down list.
- Search Title: The Search Title input box allows defining a title for the custom search, which will appear in the search menu of the Map View.
- Search Group: The Search Group input box allows the administrator to combine searches into specific search groups. The groups are created and ordered from the Search Order utility.
- Define the search Attribute Data:
- Datasource: Select the data source name to search and read from.
- Table: Select a search table from the drop-down menu for the search to work on.
- Join Key: It is recommended to verify in MapGuide Maestro whether the layer searched on has a where-clause defined and enter the same one in enlighten plus any other variables required (i.e.: LSTATUS = 'R'). This information can be viewed in MapGuide Maestro in the layer editor under ‘Resource Settings > Layer Settings > Filter’.
- Where: You have the option of entering a SQL where clause to restrict the search to specific objects characteristics. For example, when searching for a parcel, it is possible to specify LSTATUS = 'R' so that the table of results will only display registered parcels.
- Define the search Spatial Data:
- Layer: Select the layer that will be highlighted on the map when viewing the search results.
- Table: Spatial data associated with the selected layer. For example, when searching for house numbers starting with 1 in Rose Avenue, the objects highlighted on the map will be land parcels corresponding to 1 Rose Avenue. The table SP_STRADDR and the table SP_PARCEL have been linked together via a link column.
- Primary Key: The Column used to uniquely identify records within the spatial table.
- Link Key: Select a spatial column to link with the search column.
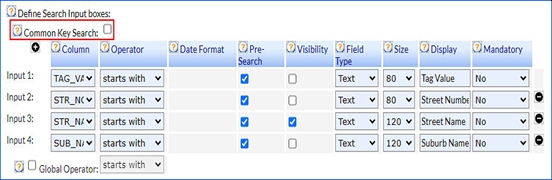
Fig: Define Search Input boxes
- Common Key Search: Allows a search to find results across multiple components. A Component is an additional set of spatial and attribute data that can be added to a search.
- When a component is added to a search that shares the same key (column) a common key search can be created.
- A common key search will query information from the search and search components. Allowing users to enter for example GID values that may belong to several tables and return results.
- When a common key search has been configured in the administrator's environment. The user can enter comma separated lists in the search field in the user environment.
An example of a component that has been added to a search enabling the search to find GID results across all the component fields when the common key search is selected.
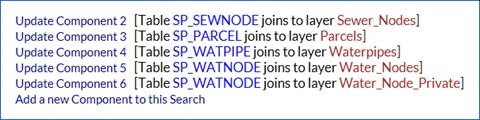
Fig: Common Key SearchThe linked search components will appear at the bottom of the Add / Edit Search page, displaying the component number, spatial table and layer name. The administrator can then click interchangeably between each of these with the components and related information updating automatically.
- Defining Search Input Boxes: Each custom search must have at least one input box defined. Input boxes will then appear in the Search Menu accessible from the map window. It is possible to add up to four input boxes, each of which will appear as an input field of the Search Menu when a search is selected.
Fig: Define Search Input boxes - Define the input boxes:
- Column: Select the column containing the data to be searched.
- Operator: Select the operator that will appear as default for each search.
- Date Format: Select date format for displaying the date input.
- Pre-Search: Allows the administrator to enable/disable the pre-search option.
- Visibility: Define whether the operator will be displayed or not. If the box is unchecked, the operator set as default will apply.
- Field Type: This defines the search criteria type, which is required to be entered in the search pane.
- Text: This allows the user to input specific user defined text as a search parameter.
- Lookup: If a lookup table has been defined, a drop-down list of values from the corresponding lookup will be available. This will be visible when performing a search.
- Free Text: This will be represented by a text area and has a multiple line delimiter which will be replaced with commas.
- Size: Specify the width of the input box in pixels (2 - 250). Where 2 is the smallest input box.
- Display: Specify the default text that will appear in the input box before the user enters a keyword. This should indicate the type of value the user is expected to enter. For example, if the search requires entering a name, type Name in the display box.
- Mandatory: Specify whether a field is mandatory or not. If the user does not enter a value in a mandatory input box, the system will prompt for it.
- Defining Show Info Report: This allows the search result listing to be displayed in a Show Info form. If a single result satisfies the search criteria and the Zoom direct to map check-box (Below the search criteria in Map View) is ticked, then the result will still be shown on the map. If this check-box was not ticked, then the single result will be sent to the Show Info form.
- Defining the Search Result Display: This section allows the definition of columns that will appear in the Search Results window when a custom search is performed.
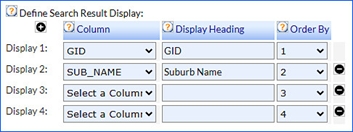
Fig: Define Search Result Display - To show the results from a search the following information must be defined for each column:
- Column: The name of the column to display in the search result window.
- Display Heading: A column heading as it will appear in the search result window.
- Order By: The sort order of the results.
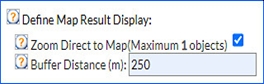
Fig: Define Map Result Display
- Design Map Result Display: Additional options exist for map results to be displayed:
- Zoom Direct to Map: This will zoom directly to the feature when one item is the result of a search.
- Buffer Distance: Will zoom to the search results with the specified buffer distance around the feature(s).
- Add a new Component to this search: Adding components allows searching across different tables or over multiple layers within the same data source while the standard search only searches a single table. This option would be available once the user clicks in the checkbox Common Key Search.
- To save the search click on the Save button at the bottom of the screen. The page should then refresh, taking the administrator to the current search setup.
Edit Search
To edit a search the following steps can be followed:
- Navigate to Admin View > Map Administration > Search.
- Select the Search from the 'Please select the Search you wish to Edit or create a new one' drop-down list.
- Change any of the fields ,components or add new components.
- To save the search click on the Save button at the bottom of the screen. The page should then refresh, taking the administrator to the current search setup.
Note: If the search contains a lookup table, only tables with the same lookup table can be added as a component. e.g. You can set up a search that identifies all Sewer Gravity Pipes and all the Sewer Rising Pipes that are made of a specific material.
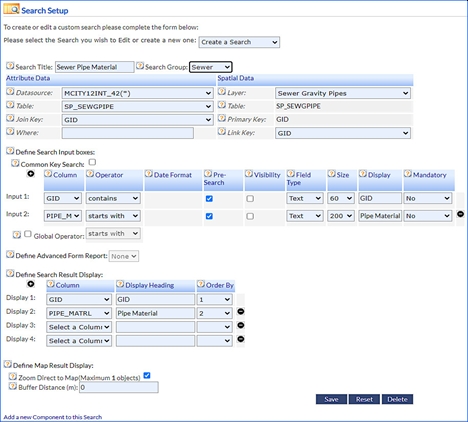
Fig: Setting a search for Sewer Gravity Pipes
Add a Component to a Search
To add a Component to a search the following steps can be followed:
- Navigate to Admin View > Map Administration > Search.
- Select the Search from the 'Please select the Search you wish to Edit or create a new one' drop- down menu.
- Select Add a new Component to this Search.
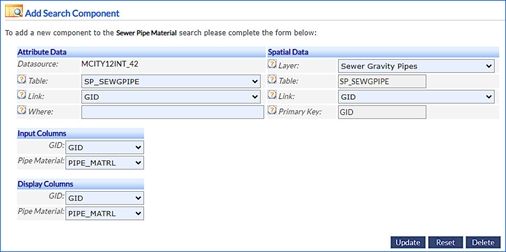
Fig: Add Search component for Sewer Rising MainsNote: Both layers share a column storing the pipe material (PIPE_MATRL). - To add the new component search to the search click on the Update button at the bottom of the screen. The page should then refresh, taking the administrator to the current search setup.
Delete Search
To delete a search the following steps can be followed:
- Navigate to Admin View > Map Administration > Search.
- Select the Search from the 'Please select the Search you wish to Edit or create a new one' drop- down menu.
- To delete the search click on the Delete button.
- Select OK to confirm the search deletion.
It is important to note that if any input columns are added/removed from the base search form, then each component using those input columns will also need to be added/removed before saving the search. If the administrator does not update each of the components respectively, and attempts to save the search, then the system will flag the error below:
Current search contains component(s) with different amount of input/display columns.
Please solve this issue in admin page before you could run the search.
In addition to the error displayed above, each search component which is affected will be flagged with a red highlight, prompting the user to rectify before saving the search.
Search Group
To add a new group to the Search Order the following steps can be followed:
- Navigate to Admin View > Map Administration > Search Order.
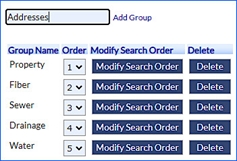
Fig: Search Order - Enter a name that uniquely identifies the group in the Add Group text box.
- Click on the Add Group button to add the new group.
- The new group will be displayed in the Group Name list.
The searches contained in the search groups will then be displayed in the Map View with separators between each group, for example, the search Water Nodes belongs to the group Water.
Modify Group Search Order
To modify the Groups Search Order the following steps can be followed:
- Navigate to Admin View > Map Administration > Search Order.
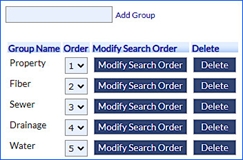
Fig: Group Name Display Order - Change the order of the Groups by selecting the Order Number next to the Group Name. This determines the order in which the groups and their respective searches are displayed in the Search List.
- The administrator can now confirm the Search order has changed, as specified.
Modify Individual Searches within Groups
To modify the order of the individual Searches within the Groups the following steps can be followed:
- Navigate to Admin View > Map Administration > Search Order.
- To change the order of the individual searches by selecting the Modify Serch Order next to the Group Name. This determines the order in which the individual searches within their respective Groups are displayed in the Search List.
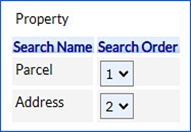
Fig: Search Names within the Search Groups - The administrator can now confirm the Search order has changed, as specified.
Note: To delete a group, it must not contain any searches, to delete searches see Delete Search.
Layer Filter
Layer Filter functionality allows filtering a layer in enlighten, by overwriting the layer where clause set in MapGuide Open Source. Similar to the search functionality, the layer filter uses SQL statements to display only entities within a layer that meets specific criteria. When the layer filter is active the objects that are filtered out are temporarily removed from the map.
Layer filter data sources are defined in the <connectionStrings> section of the web.config file that can be found in the root folder of your enlighten website. Below is an example of a valid connection strings section with one additional connection string specified for layer filtering:

Fig: Connection Strings
Add a Layer Filter
To create a new filter the following steps can be followed:
- Navigate to Admin View > Map Administration > Layer Filter.
- Select Create a Filter from the Layer Filter drop-down list.
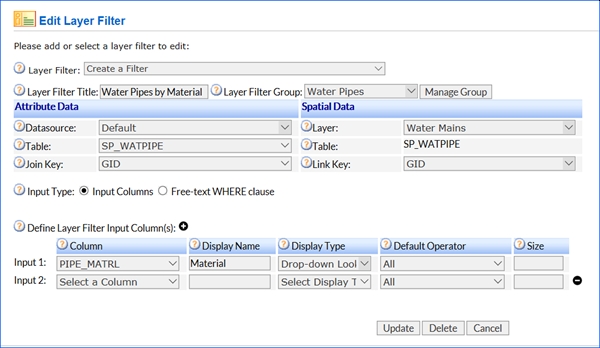
Fig: Create a Filter - Defining the Filter:
- Layer Filter Title: Enter a name that uniquely identifies the filter.
- Layer Filter Group: Select a group you wish to place the layer filter in.
- Attribute Data: This will be the fields that you may filter on.
- Datasource: Choose the desired data source from the drop-down list.
- Table: Choose a table that contains attribute data.
- Join Key: Select a column that can join the attribute and spatial data.
- Spatial Data: This field defines the spatial features that will be filtered.
- Layer: Select a Layer you want your spatial data to be based on.
- Table: The spatial table is automatically generated when you select a layer.
- Link Key: Select a column that also exists in the attribute data.
- Input Type: The input type defines how the user will set filter parameters. There are two types of inputs:
- Free-text WHERE clause: If this is selected then the user will have a box in which they can enter SQL to define filters. If this check-box is selected the user can query using any of the available parameters in the table.
- Input Columns: The input columns settings will define how the user sees and uses the filter in the user environment.
- Define Layer Filter Input Columns:
- Column: Select the parameter on which you wish to filter.
- Display Name: This is the name the user will see when they are using a filter.
- Display Type: Three options are available to display this information in the user environment. If you select Text, the user will type in the parameter. If you select Drop-down Lookup and a lookup has been defined for the data, the options will appear in a drop-down list in the user environment. If you select Tree Lookup and a lookup is defined the options will be displayed in the user environment as a tree view in which you select check-boxes and multiple features can be selected. When Tree Lookup is selected you cannot select any operators.
- Default Operator: The user will still have access to the operator drop-down list if an operator is selected. The operator chosen in this setting will automatically be selected when the filter is open.
- Size: If entering Free Text, the number of characters allowed in the field can be defined in this setting.
Note: Layer filter functions must be assigned to the users, to assign layer filter permissions please see Manage Users & Permissions Functions. - To save the layer filter click the Update button.
Edit a Layer Filter
To edit a layer filter the following steps can be followed:
- Navigate to Admin View > Map Administration > Layer Filter.
- Select Layer Filter from the Layer Filter drop-down list.
- Make the relevant changes as needed.
- Save the changes by clicking the Update button.
Delete a Layer Filter
To edit a layer filter the following steps can be followed:
- Navigate to Admin View > Map Administration > Layer Filter.
- Select Layer Filter from the Layer Filter drop-down list.
- Delete the layer filter by clicking the Delete button.
Add a Layer Filter Group
Layer filters are organized into groups. Layer filters are assigned to groups in the Edit Layer Filter section. To create a new group, select Create a Group from the Manage Group section and enter a name as shown below. You can change or delete the group name in the Layer Filter Group section by selecting the group in the drop-down list.
To create a layer filter group the following steps can be followed:
- Navigate to Admin View > Map Administration > Layer Filter.
- Click the Manage Group button to open manage layer filter groups.
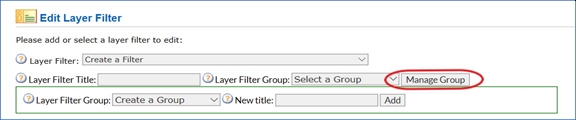
Fig: Creating a layer filter group - Select Create a Group from the Layer Filter Group drop-down list.
- Enter a name that uniquely identifies the group in the New Title text box.
- Add the group by clicking the Add button.
Edit or Delete a Layer Filter Group
To edit a layer filter group the following steps can be followed:
- Navigate to Admin View > Map Administration > Layer Filter.
- Click the Manage Group button to open manage layer filter groups.
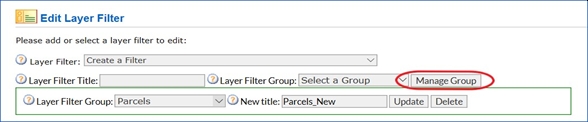
Fig: Edit or Delete a Layer Filter Group - Select the group from the Layer Filter Group drop-down list.
- To edit the group name type the new name in the New Title text box.
- To update the group name click the Update button.
- To delete a group, select the group name from the Layer Filter Group drop-down list and click the Delete button.
enFact
enFact is an enlighten module which enables users to register one or more Artifacts. Artifacts are any files located in a predefined Network drive and can include but are not limited to images, operation manuals, as-constructed drawings, and plans. The associated metadata is definable by the administrator and is based on templates.
There are five steps required to setup enFact:
- Create an enFact Layer in MapGuide Maestro
- Define network location of artifacts
- Maintain Metadata
- Define and maintain Metadata Templates
- Define and maintain artifact Types
Creating an enFact Layer in MapGuide Open Source (MGOS)
An enFact layer needs to be added into MGOS with the details provided in the table below. See Adding a Layer in AIS.
| Feature Class | Save As |
| SP_ENFACT | enFact |
Fig: enFact Layer naming
Once the enFact layer has been created it needs to be added to enlighten. See adding a group to enlighten for more details. Ensure the enFact layer has the top position in the drawing order tab.
Add an enFact – Artifact Location
To create a new enFact – Artifact Location the following steps can be followed:
- Navigate to Admin View > Map Administration > enFact > Artifact Location.
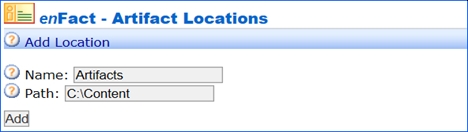
Fig: Adding an Artifact Location - Define the Artifact Location:
- Name: The name must be the same as the alias that you will set up in the virtual directory.
- Path: The physical path where the artifact data is stored. The content can reside on the local computer or come from a remote share. If your content is stored on the local computer, enter the physical path, such as C:\Content. If your content is stored in a remote share, enter the network path, such as \\Server\Share.
- 3. Add the Artifact Location by clicking the Add button.
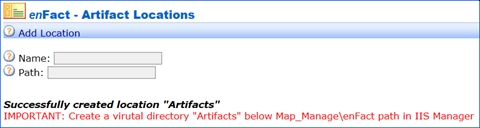
Fig: Successfully added an Artifact Location
Edit an enFact – Artifact Location
To edit an enFact – Artifact Location the following steps can be followed:
- Navigate to Admin View > Map Administration > enFact > Artifact Location.
- Select the location name from the Location drop-down list below Edit Location.
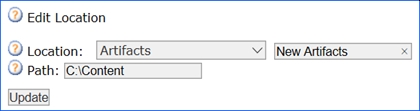
Fig: Edit Artifact Location Name and Path - To change the artifact location name, type the new name in the text box net to Location.
- To change the path add the new path in the Path text box.
- Save the changes by clicking the Update button.
Delete an enFact – Artifact Location
To delete an enFact – Artifact Location the following steps can be followed:
- Navigate to Admin View > Map Administration > enFact > Artifact Location.
- Select the location name from the Location drop-down list below Delete Location.
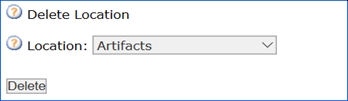
Fig: Delete Artifact Location - To delete the location click the Delete button.
Creating Virtual Directory for Artifact Location
To create a virtual directory for Artifact Location the following steps can be followed:
- On the server that is hosting your enlighten webpage, go to the Start menu and select Administrative Tools > Internet Information Services (IIS) Manager.
- In the Connections pane of IIS Manager, navigate to the enFact directory of your enlighten website.
The enFact directory is located at: enlighten Website\Map_Manage\enFact. - Right-click on the enFact folder and select Add Virtual Directory on the menu that appears.
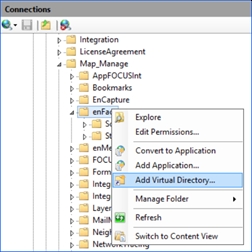
Fig: Connections Tree View, Add Virtual Directory - Complete the Add Virtual Directory dialog as follows:
- Alias: Type the name that you used in the Artifact Location section of the enFact administration section of enlighten.
- Physical Path: Type or navigate to the physical path where the artifact data is stored. The content can reside on the local computer or come from a remote share. If your content is stored on the local computer, enter the physical path, such as C:\Artifacts\Pump_Stations. If your content is stored in a remote share, enter the network path, such as \\Server\Share.
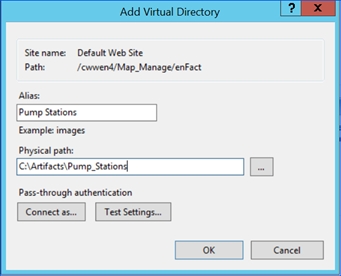
Fig: Add Virtual Directory Dialog Box
- Press OK on the Add Virtual Directory dialog. In the Connections pane of IIS Manager, you should see a new folder added to the enFact folder of your enlighten website.
Accessing Artifacts Stored at Network Locations
To access artifacts stored in a remote share (network location), you must complete the steps below before creating the virtual directories.
- Create a domain user for enFact and assign read permissions to all network artifact locations.
- Assign full permissions on the enlighten website folder to the enFact domain user created in the previous step.
- On the server that is hosting your enlighten webpage, go to the Start menu and select Administrative Tools > Internet Information Services (IIS) Manager.
- Create a enFact web application by choosing Convert to Application option.
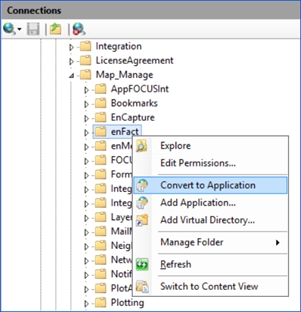
Fig: Convert to Application - To confirm the Add Application press OK.
- In the Connections pane of IIS Manager go to [Machine Name](Local computer), and in the Features View click MIME Types.
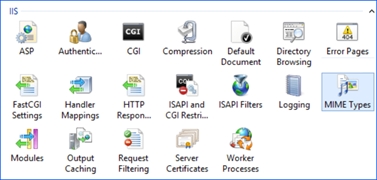
Fig: MIME Types - Click on Add in the Action Panel. Complete the Add MIME Type dialog as follows:
- File name extension: Type ".dwg".
- MIME type: Type "image/x-dwg".
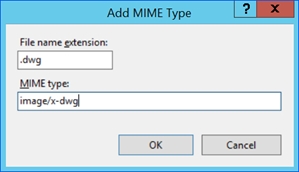
Fig: Add MIME Type
- To confirm the Add MIME Type press OK.
- In the Connections pane select Application Pools.
- In the Mid panel right-click on the enlighten application pool and select Advanced Settings.
- In Advanced Settings go to General > .NET CLR Version and select v4.0.
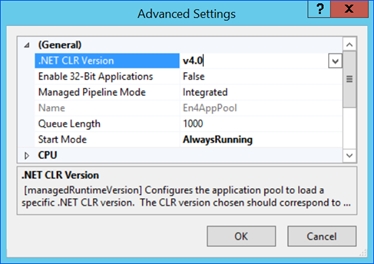
Fig: Application Pool .NET CLR Version Settings - In Advanced Settings go to Process Model > Identity and select the enFact domain user.
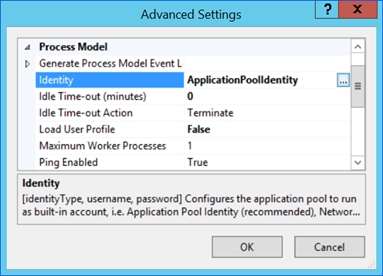
Fig: Process Model Identity Settings - Select Identity to change the Identity Settings.
- Select the Custom account.
- Click on the Set button to set the credentials.
- Type in the domain credentials which was created for the enFact user.
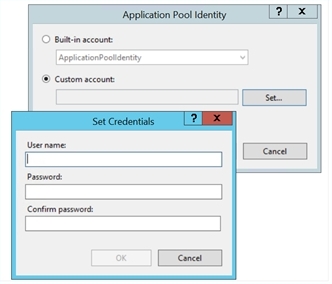
Fig: Changing Identity Settings - To confirm Set Credentials press OK.
- To confirm Application Pool Identity press OK.
Add enFact – Artifact Type
An Artifact Type defines a category in which artifacts are placed. enlighten users will select an artifact type to classify their artifacts.
To create an enFact – artifact type the following steps can be followed:
- Navigate to Admin View > Map Administration > enFact > Artifact Type..
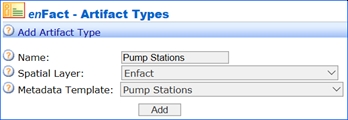
Fig: Add Artifact Type - Define the Artifact Type:
- Name: Describes what the user will choose when classifying artifacts.
- Spatial Layer: Must be enFact.
- Metadata Template: Will define the layout available in the map view.
- Add the artifact type by clicking the Add button.
Edit enFact – Artifact Type
To edit an enFact – artifact type the following steps can be followed:
- Navigate to Admin View > Map Administration > enFact > Artifact Type..
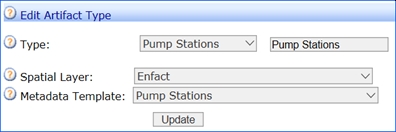
Fig: Edit Artifact Type - Select the artifact from the Type drop-down list.
- Change the Metadata Template associated with the Type.
- Save the changes by selecting Update.
Delete enFact – Artifact Type
To delete an enFact – artifact type the following steps can be followed:
- Navigate to Admin View > Map Administration > enFact > Artifact Type.
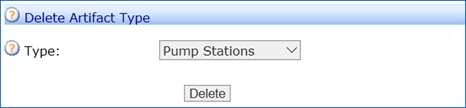
Fig: Delete Artifact Type - Select the artifact to be deleted from the Type drop-down list.
- To delete the artifact type select Delete.
Artifact Symbols
To configure symbols for enFact – artifact the following steps can be followed:
- In MapGuide Maestro expand your site folder, expand the Layers folder and double-click on the enFact layer in the Site Explorer tree view.
This will open the Layer Definition Editor.
- Select Layer Styles in the layer window and select a symbol.
For more detailed information on how to configure a symbol for artifacts please refer to Theming a Layer in MapGuide Maestro.
enFact – Metadata
In the enFact administration screen, you can create, delete and edit metadata for artifacts. The metadata for enFact is visible in the user interface when adding artifacts to the map.
To edit enFact – Metadata the following steps can be followed:
- Navigate to Admin View > Map Administration > enFact > Metadata.
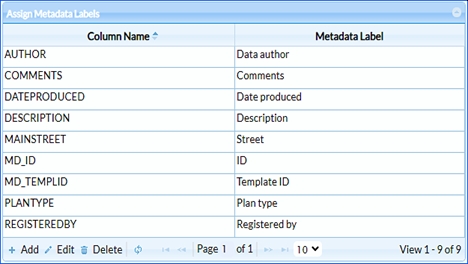
Fig: enFact Maintain Metadata ColumnsNote: Adding new columns into EN_EF_METADATA is achieved via a database administration tool. - To edit metadata columns, select the column name and click the Edit button.
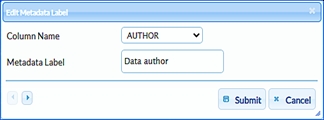
Fig: enFact Edit Metadata Table - Enter a name that uniquely identifies the metadata in the Metadata Label text box.
- To save the metadata label, click the Save button.
Note: Adding new columns into EN_EF_METADATA is achieved via a database administration tool. - To delete metadata columns, select the column name and click the Delete button.
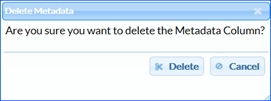
Fig: Delete enFact Metadata
To add a metadata column after it was deleted the following steps can be followed:
- Navigate to Admin View > Map Administration > enFact > Metadata.
- To add metadata columns, click the Add button.
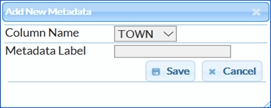
Fig: enFact Add New Metadata - Select the metadata column name from the Column Name drop-down list.
- Enter a name that uniquely identifies the metadata in the Metadata Label text box.
- To add the metadata column, click the Save button.
Add enFact – Metadata Templates
The information selected in a metadata template defines the information to be added in the user environment. The template will be assigned to an artifact type.
To create a new enFact – Metadata Template the following steps can be followed:
- Navigate to Admin View > Map Administration > enFact > Metadata Templates.
Note: Adding new columns into EN_EF_METADATA is achieved via a database administration tool.
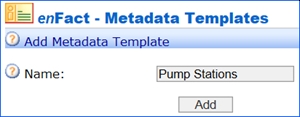
Fig: Add Metadata Template - Enter a name that uniquely identifies the metadata template in the Name text box.
- Add the metadata template by clicking the Add button.
Associate enFact – Metadata with Templates
To associate enFact – Metadata to this new template the following steps can be followed:
- Navigate to Admin View > Map Administration > enFact > Metadata Templates > Edit Metadata.
- Select the template name from the drop-down list in the Edit Metadata Template section.
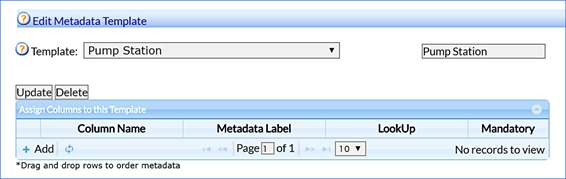
Fig: Adding a Metadata Template - The Assign Columns to This Template will appear and will be empty.
- To assign metadata to this template select Add.
- Define the metadata template:
- Column Name: Select the column name from the drop-down list.
- Metadata Label: describes the values from the Metadata section.
- Lookup: Allows you to add a table which will appear as a drop-down list in the user interface.
- Mandatory: Indicates if the field must be entered in the user environment.
- Add the metadata columns by clicking the Save button.
Edit enFact – Metadata Templates
To edit metadata columns the following steps can be followed:
- Navigate to Admin View > Map Administration > enFact > Metadata Templates > Edit Metadata.
- 2. Select the template name from the drop-down list in the Edit Metadata Template section.
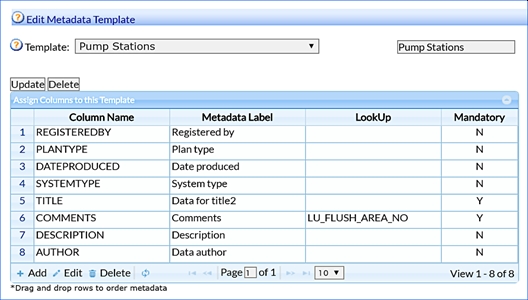
Fig: Editing a Metadata Template - The Assign Columns to This Template will appear.
- To edit metadata columns select Edit.
- Edit the metadata template:
- Column Name: Select the column name from the drop-down list.
- Metadata Label: describes the values from the Metadata section.
- Lookup: Allows you to add a table which will appear as a drop-down list in the user interface.
- Mandatory: Indicates if the field must be entered in the user environment.
- Save the metadata columns by clicking the Save button.
Delete enFact – Metadata Templates
To delete metadata columns the following steps can be followed:
- Select the template name from the drop-down list in the Edit Metadata Template section.
- The Assign Columns to This Template will appear and will be empty.
- To delete metadata column select Delete.
- Confirm deletion of the metadata column by selecting Delete.
Network Trace
Network trace allows you to follow a pipe or node to others that would be affected if it were to be shut down in the event of planned maintenance for example. The layers to be analyzed and the stop predicates for Network Trace, are defined in the enlighten administrator section. These settings are saved in the table EN_SEARCH_INFO.
Network Trace Setup
There are several steps involved in setting up the network trace:
- Adding a network trace group in MapGuide Maestro.
- Adding network trace layers in MapGuide Maestro.
- Database configuration for water network tracing.
- enlighten Network Trace Administration.
- Stop Predicates Administration.
Add a Network Trace Group in MapGuide Maestro
To create a Network Trace Group the following steps can be followed:
- In MapGuide Maestro expand your site folder and double-click on the Map Definition file located in the Site Explorer tree view.
- Select Layers in the map definition window.
- In Layers select Layers by Groups.
- Select Add a new group in the Layers by Group toolbar.
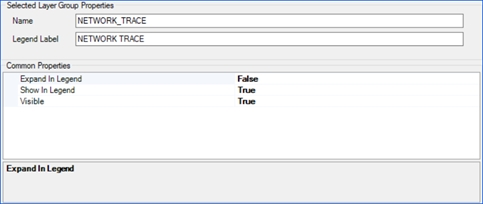
Fig: Network Trace Group Settings in MGOS - Define the group:
- Name: Must be 'NETWORK_TRACE'
- Legend Label: Must be 'NETWORK_TRACE'
- Common Properties:
- Expand In Legend: Set to 'False'.
- Show In Legend: Set to 'True'.
- Visible: Set to 'True'.
- The affected layers should be placed on top of the base map layers. For more detail on layer drawing orders refer to Changing Drawing Order.
Add Network Trace Layers in MGOS
Follow the Validate Predefined Network Trace Affected layers instructions, within the enlighten installer guide and add the layers to the NETWORK_TRACE group.
The following layers need to be added in the map definition in MapGuide Maestro before Network Trace can be set up in enlighten.
| FEATURE CLASS | SAVE AS | LAYER NAME |
| VW_NT_TEMP_NODES | Water_Valves_Affected | Wat_Valves_Affected |
| VW_NT_TEMP_PARCELS | Parcels_Affected | |
| VW_NT_TEMP_PIPES | Water_Pipes_Affected | Wat_Pipes_Affected |
| VW_NT_TEMP_SERVS | Water_Services_Affected | |
| VW_NT_TEMP_SEWPIPES | Sewer_Pipes_Affected | Sew_Pipes_Affected |
| VW_NT_TEMP_SEWSERV | Sewer_Services_Affected | Sew_Serv_Affected |
| VW_NT_TEMP_BUILDINGS | Buildings_Affected | |
| VW_NT_TEMP_FIBNODES | Fiber_Nodes_Affected | Fiber_Nodes_Affected |
| VW_NT_TEMP_FIBPATHS | Fiber_Path_Affected | Fiber_Path_Affected |
| NT_TEMP_FIBLOC | OTDR Location | OTDR Location |
Fig: Layers to be added in Mapguide Maestro
The Filter Applied to Layer Settings: where clause 1=0 disables the layers when network trace is not being performed. This clause essentially makes the layer invisible unless the trace requests the layer to become visible. There could be multiple historical traces being displayed unnecessarily, therefore this filter condition is applied.
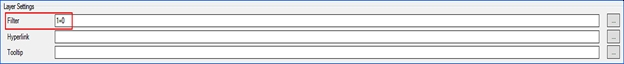
Fig: Layer filter settings in Mapguide Maestro
When network tracing is run, the affected layers will be turned on automatically and become highlighted.
The Affected Layers are the layers where the output objects obtained from a Network Trace analysis are displayed. All the relevant affected layers are activated automatically when network tracing is performed.
Database Configuration for Water Network Trace
While no database configuration is required for Sewer Network Trace, the table NT_WAT_TYPE must be configured for Water Trace, once the Network Integrity has been verified.
As shown below, the NODE_TYPE column contains the node type definition in SP_WATNODE while NT_TYPE is used by the network trace process to determine which action to undertake.
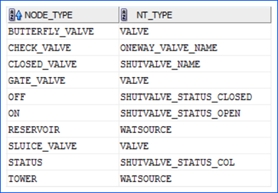
Fig: Network Integrity Verification
The one-way valve and the shut valve can be included in the Network Trace process. However, these need to be defined in the NT_WAT_TYPE table as shown above. In this example, the NODE_TYPE for the one-way valves is the CHECK_VALVE while the NODE_TYPE for shut valves is CLOSED_VALVE.
For the closed valves, the status value is used to identify the trace action, if the valve is open the trace will continue if the valve is closed that trace will stop. The status value for closed/open valves must be defined with a value that can be for example ON/OFF or OPEN/CLOSED as shown above.
The user can choose to perform either a Part Trace or a Full Trace.
If the user chooses to perform a Part Trace, the trace will stop when the closed or nearest valve has been reached; the trace will traverse the network in all directions from a given point of failure/leak and calculate the valves that will define a shut-off block.
At this stage, the user can decide to extend the trace to the next nearest valve (Trace Through option). If Full Trace is selected, all the sections of the network that do not have any other source of supply will be selected; the trace will calculate if any part of the network is also affected by the trace i.e., the trace will consider if a water source is available to other parts of the network. This second stage trace will also pick up dead-ends etc. that may also be affected by a shut-off.
Trace Through: If a valve cannot be physically closed for any reason (rusted/covered), the user can select the offending valve on the map and trace through that valve, re-calculate and extend the trace to exclude that valve from the network trace.
Before running the trace, the user can choose which layers will be displayed in the Water Pipe Trace Results window. If the service connection table contains both parcel GID and property GID data, the user can choose to see either the affected parcels or the affected properties in the result window.
Enlighten Network Trace Administration
To setup Network Trace Navigate to Admin View > Map Administration > Network Trace.
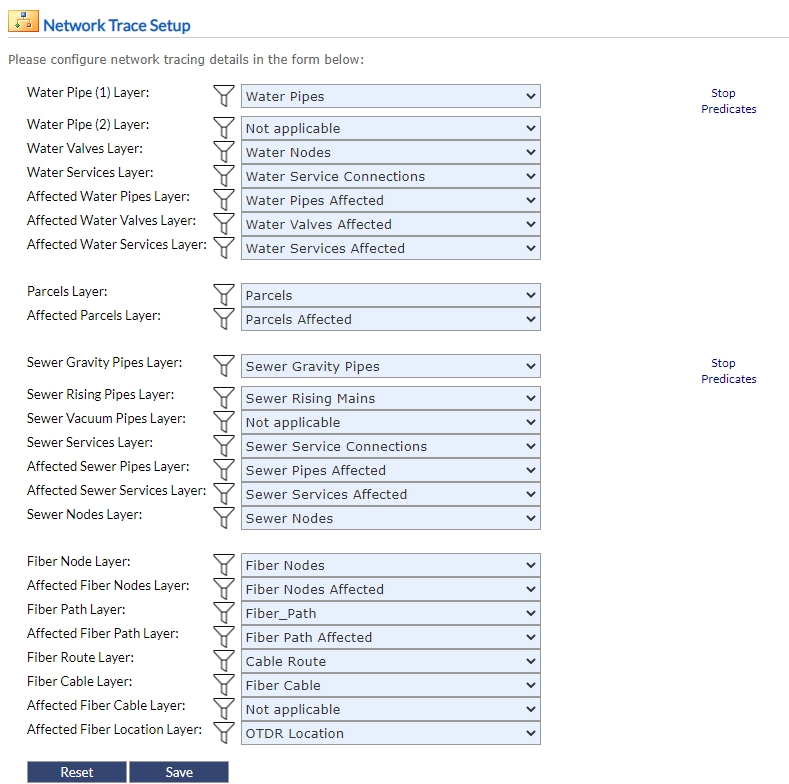
Fig: Network Trace
In this page, the user can configure three types of Network Traces i.e. Water, Sewer and Fiber Network Traces. In the instance where Water pipes maybe stored in two different layers (Reticulation and Transfer Mains) both layers Water Pipe (1) and Water Pipe (2) will be analyzed by the tracing. If water pipes are stored in a single layer, as per the example above, only Water Pipe (1) Layer needs to be configured and Water Pipe (2) layer must be set to not applicable.
In order to run a building or property network trace refer to the Site Administration > Configure Settings > Network Trace – Service Link to Property section of this document.
After selecting building or property, the Parcels Layer and Affected Parcels Layer settings on the Network Trace Settings page will update to either Building Layer and Affected Building Layer or Property Layer and Affected Property Layer. These must then be populated to allow the option to be available during Network Trace. Users can then add or remove parcels, properties or buildings from the selection based on the option selected.
If the administrator defines the Water Pipe (1) Layer as "Not Applicable" then all water settings will be turned off and the network trace will become primarily Sewer.
As a corollary to the above, if Sewer Gravity Pipes layer is set to "Sewer not available", the administrator will notice that all the Sewer settings have been disabled.
Stop Predicates
Stop Predicates force a network trace to terminate prematurely if a certain condition is satisfied. Stop Predicates can only be configured currently for the Water and Sewer Network traces.
Add Stop Predicates
To create a stop predicate the following steps can be followed:
- Navigate to Admin View > Map Administration > Network Trace > Stop Predicates.
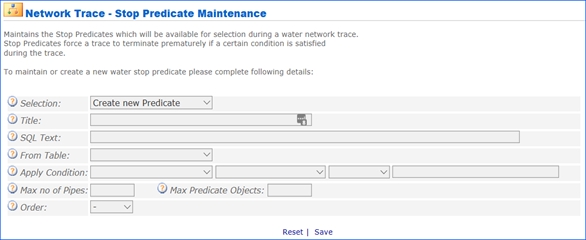
Fig: Create a New Stop Predicate - Define the Stop Predicate:
- Title: Enter a title that uniquely identifies the stop predicate in the Title text box.
- SQL Text: This statement will automatically build as you make further selections.
- From Table: This is where you choose a pipe or node as a stop predicate.
- Apply Condition: This row contains numerous options for predicate conditions.
- The first drop-down box contains the headings available in the database table.
- The second drop-down box allows you to select a function, six functions are available:
- Left Trim: Removes all leading spaces
- Right Trim: Removes all trailing spaces
- Lower Case: Converts all characters to lower case
- Upper Case: Converts all characters to upper case
- To Number: Converts all characters to upper case
- NT_CONV_VAR2NUM: Will strip off any non-numeric digits to ensure the number comparison cannot fail.
- The third drop-down box contains operators that will define the conditions of the stop predicate.
- The fourth drop-down box lists the available choices from the condition selected in the first drop-down box. You can set a condition by selecting a defined value, choosing the values from a list or entering them as free text.
- Maximum Number of Pipes: This defines the maximum number of pipes to be searched in all directions when in use the search will stop at the predicate condition or number of pipes defined here. This field is editable in the map view.
- Maximum Predicate Objects: Maximum allowed pipes/nodes that satisfy the predicate condition. This field is editable in the map view.
Note: This field is the highest priority when a network trace is performed and will overwrite any other information, it is advised to leave the default field blank. - Order: Order in which the stop predicates appear in the selection list in the map view.
- Save the stop predicate by Clicking the Save button.
Edit Stop Predicates
To edit a stop predicate the following steps can be followed:
- Navigate to Admin View > Map Administration > Network Trace > Stop Predicates.

Fig: Edit Stop Predicate - Select the stop predicate from the Selection drop-down menu.
- Edit the stop predicate.
- Update the stop predicate by clicking the Save button.
Delete Stop Predicates
To delete a stop predicate the following steps can be followed:
- Navigate to Admin View > Map Administration > Network Trace > Stop Predicates.
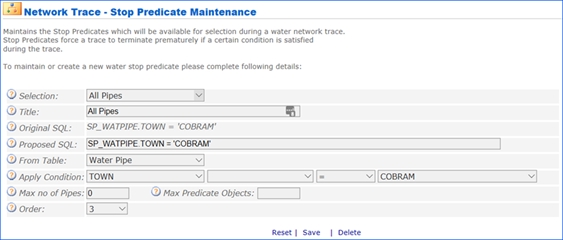
Fig: Delete Stop Predicate - Select the stop predicate from the Selection drop-down menu.
- Delete the stop predicate by clicking the Delete button.
Assign Permissions to Stop Predicates
To assign stop predicates to users the following steps can be followed:
- Navigate to Admin View > User Administration > Manage User and Permissions > Functions.
- Select a user from Permissions Management.
- Select Functions from Permissions and scroll down to Advanced.
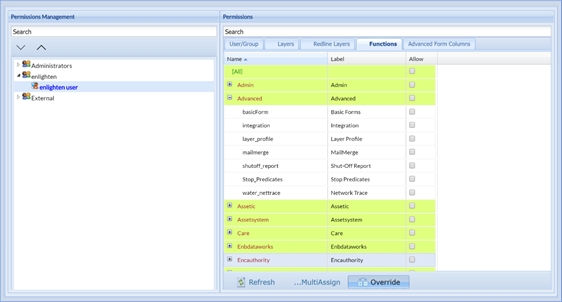
Fig: Assigning Stop Predicates to a User - Check the Stop_Predicates Allow check-box to enable stop predicates.
- Save the permissions by selecting the Save option on the top right corner of the Permissions Management interface.
Redline Layers
The Redline Layer Setup utility allows managing Redline layers.
Add a Redline Layer
To add a new redline layer the following steps can be followed:
- Navigate to Admin View > Map Administration > Redline Layers.
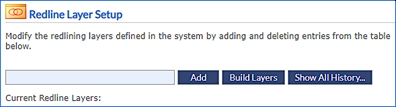
Fig: The Redline Layer Setup page - Enter a name that uniquely identifies the redline layer in the text box.
- To add the redline layer click on the Add button.
The administrator will be prohibited from saving a Redline Layer Name identical to a Layer Group Name. If attempted the system will flag an error "The redline layer name already exists" and the user will need to define an alternative name for the redline layer. This newly defined redline layer is saved in the database table EN_REDLINE_LAYER. In the Admin side of enlighten, redline layers can be renamed. This will dynamically alter the layer name within the _PE map definition simultaneously for conformity.
The group and layers are saved in MapGuide Maestro using the matching numeric value from the table. The new group contains five new layers representing the different redline geometries.
The group and its associated layers will also appear in the Map View window.
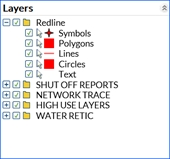
Fig: Map Layer List
Additions to the Redline Symbol Library
To create a custom symbol library to be used in conjunction with the redline functionality then the user should ensure that the following is done sequentially. A list of pre-requisites has to be followed before the actual defining of redline symbols can be done. This would require the user to setup symbols and then copy them to a designated folder to make it accessible to the relevant enlighten website.
Pre-requisites:
- Symbols should be created and saved within the designated symbol library.
- Symbols should be copied into the respective enlighten website folder > Symbols.
For detailed steps outlining how to create a Symbol list for layers please consult the Map Symbol List section found under the Map Site Administration chapter of this document.
Creating the entry within the Database Table:
Once the creation of the custom redline symbols have been done, then the administrator should create the corresponding entry within the EN_SWITCHS database table. The following information is mandatory and should therefore be populated:
- SWITCH_VARIABLE: Redline_Library_X (where X is row number e.g. 1,2,3…).
- SWITCH_VALUE1: Defines the name of the library users will see in the redlining panel in the enlighten user environment.
- SWITCH_VALUE2: This refers to the symbol library name as defined in Mapguide.
- SWITCH_VALUE3: Indicates if the symbol library will be used as the default (a value of YES in this field indicates that the current symbol library is the default).
The "redlineSymbolPrefix" setting in the web.config file located in the root folder of the website defines the symbol library prefix that will be used. For example:
<add key=”redlineSymbolPrefix” value=”Library://ENLIGHTEN4/Symbols/” />
Once these values have been entered within the database table the administrator should ensure that the database changes are committed. Thereafter it is advised that IIS is restarted for the changes to take effect.
The "redlineSymbolDefault" setting is included in the web.config which allows for the importing of redline symbols. This setting entry is
<add key="redlineSymbolDefault" value="EN_Wingdings.SymbolLibrary/Circle6" />.
Redline Notification Alerts
Notification Alerts, are setup on specific redline layers and notifies the user if any changes have been made.
To enable notifications on a redline layer to a user the following steps can be followed:
- Navigate to Admin View > Map Administration > Redline Layers.
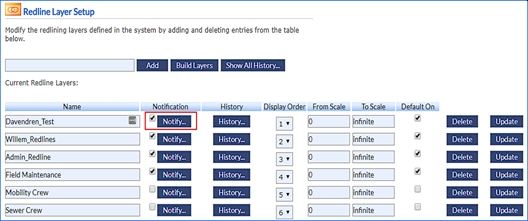
Fig: Redline Layers NotificationsNote: The Notification Alert values for Type and Status can be edited in the LU_REDLINE_EDITTYPE and LU_REDLINE_EDIT_STATUS tables. - Click the checkbox next to the Notify button and select the Notify button, for the relevant redline layer.
- Select the User or User Group, to Notify From and To.
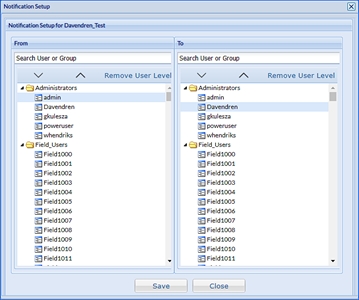
Fig: Notification Setup for RedlineNote: If the above interface doesn’t show any users or user groups, check Edit Redlines & Notify Redlines have been assigned to your user (Manage User & Permissions > Functions). - To save the notification setup select the Save button.
Redline History
The Redline History utility provides an overview on redline layer history. The redline layer history can be viewed by Group and User level.
To view redline layer history the following steps can be followed:
- Navigate to Admin View > Map Administration > Redline Layers.
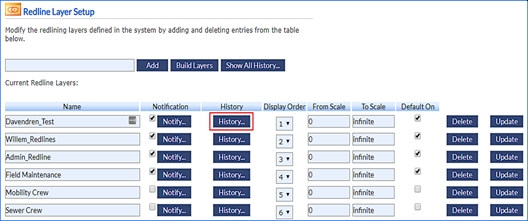
Fig: Redline Layers History - Select the History button to view the history for the relevant redline layer by Group or by User.
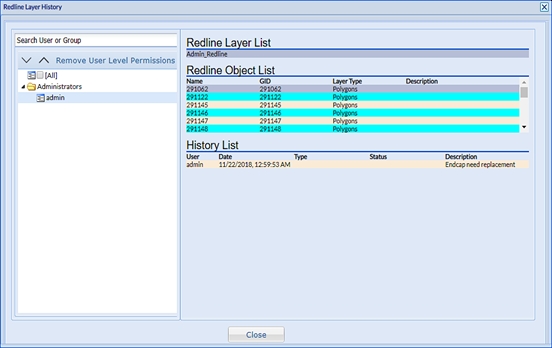
Fig: Redline Layer History Detail - Click the Close button to close the Redline Layer History
Redline Display Order
To modify the Redline Layer Display Order the following steps can be followed:
- Navigate to Admin View > Map Administration > Redline Layers.
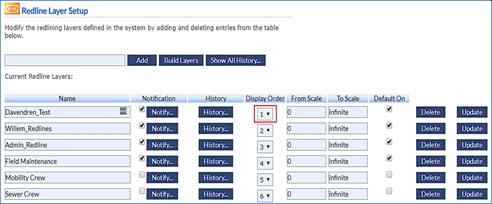
Fig: Redline Layer Display OrderNote: To ensure the "From Scale" and "To Scale" changes are implemented and displayed on the Map View then the user must click on "Build Layers" and thereafter "Update". - Change the Display order of the redline layers by selecting the Display Order from the drop-down menu. This determines the order in which the redline layer are displayed in the Redline Layer list.
Assign Redline Layers to Users
Permission must be assigned for a user to view or edit redline object in any layer.
To assign redline layer to users the following steps can be followed:
- Navigate to Admin View > User Administration > Manage User & Permissions > Redline Layers.
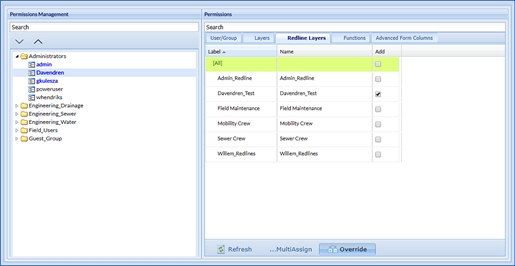
Fig: Assigning Redline Layers to users - Select the user to assign the redline layer to.
- Click on the Add checkbox next to the redline layer to be assigned.
- To assign the redline layer click on the Save button in the top right corner.
Note: Redline layers can be assigned to all users within a group by selecting the main Group heading.
Delete a Redline Layer
To delete a redline layer the following steps can be followed:
- Navigate to Admin View > Map Administration > Redline Layers.
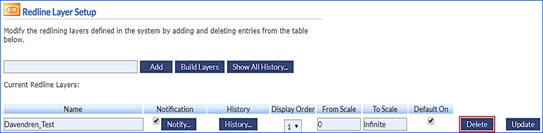
Fig: Delete a Redline Layer - Click the Delete button to delete the redline layer.
- Confirm deletion of the redline layer by clicking OK.
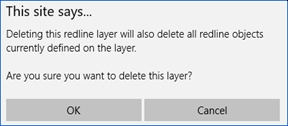
Fig: Confirm Redline Layer deletion
When a redline layer is deleted the following will be removed:
- Groups and associated layers from your map definition in MapGuide Open Source.
- Removes all redline features for the layer in the database.
- Removes the redline layer from the database.
enPlot
enPlot allows you to create and maintain Plot Applications in the Plot Application section, the administrator creates and maintains plot applications.
enPlot Applications
Plot applications can be broken down into the following two types:
- Pre-defined Plot: These are configured with their layers defined in the Plot Template Editor (PTE) Map Item and are linked to an enlighten search.
- General Plot: These do not have any layers defined and are not dependent on a search.
In the Plot Action section, the administrator can assign a plot action to the plot application, such as automatically sending out the plots via email directly from the plot engine.
Please contact support@openspatial.com for more information on Plot Action.
Add enPlot Application
To create a Pre-Defined plot application the following steps can be followed:
- Navigate to Admin View > Map Administration > enPlot > Application.
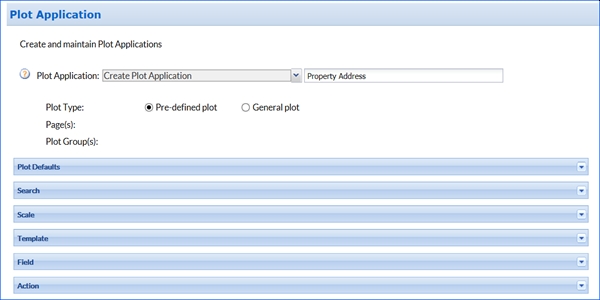
Fig: Creating a Pre-Defined Plot - Select Create Plot Application from the Plot Application drop-down list.
- Enter a name that uniquely identifies the plot application in the text box next to the Plot Application drop-down list.
- Select Pre-Defined plot as the Plot Type.
enPlot Application Defaults
- Select Plot Defaults from the Plot Application list.
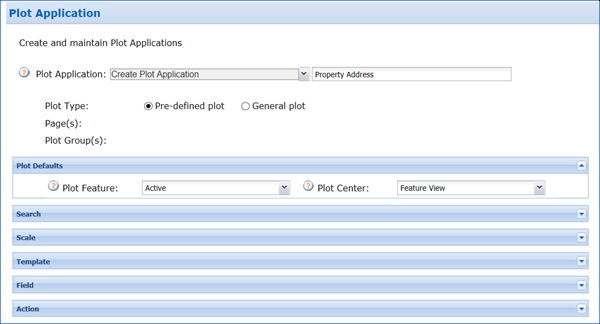
Fig: Plot Defaults - Define the Plot Defaults:
- Map Centre: Current map center co-ordinates using the scale defined in the plot application dialog box.
- Feature Centre: The output is created with the feature as the center of the plot and the map scale is dynamically calculated by the Plotting Engine, which in turn is determined by the minimum-bounding rectangle of the feature(s) of interest.
enPlot Application Search
The Plot Search is the search that will be used to locate the feature on the map. If a search has been already configured to be used by enPlot, it will be displayed in the drop-down box.
The number in parenthesis shows the number of plot applications that are using that specific search.
In the following example, the search Address is selected, and the unique attribute is PRCL_GID. The unique attribute is used in the stored procedure.
Please contact support at support@openspatial.com for more information on stored procedures.
- Select Search from the Plot Application list.
- Select a search from the Search Name drop-down list.
- Select an attribute from the Unique Attribute drop-down list.
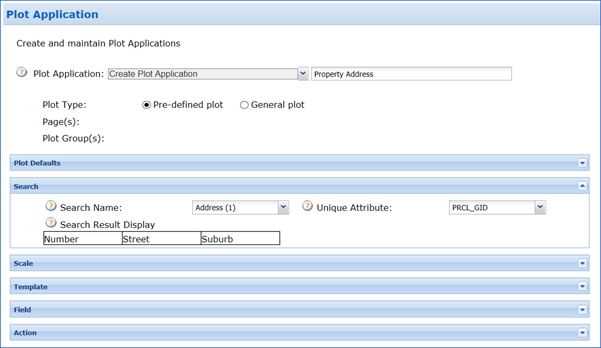
Fig: Plot Search Selection
Within this section it is crucial to remember to define a Search parameter when a Pre-defined plot is being created. If this Search parameter is not defined then the system will automatically alter this newly created plot as a General plot and display accordingly when generated in the Map View of enlighten.
enPlot Application Scale
The Scale Label is displayed in the Plot Application Dialog box. The scale input type can be a text box where the user enters any value manually or a list where the user must choose from a predefined set of scale values.
- Select Scale from the Plot Application list
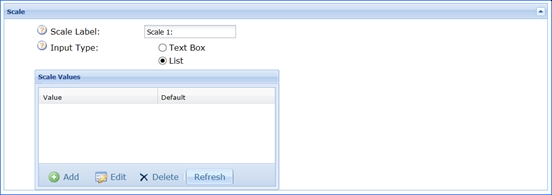
Fig: Plot Scale - Enter a name that uniquely identifies the plot scale in the Scale Label text box.
- Define the Input Type:
- Text Box: Enter any set of scale values manually.
- List: A predefined list of set scale values to choose from.
- Select List as the Input Type.
- Select the Add button to create a list of set scale values.
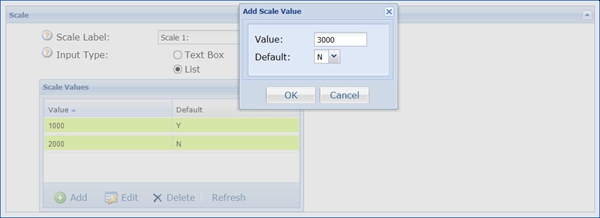
Fig: Adding Scale Values - Click OK to add the scale values.
enPlot Application Template
The plot application is associated with a plot template created using the Plot Template Editor.
- Select Template from the Plot Application list.
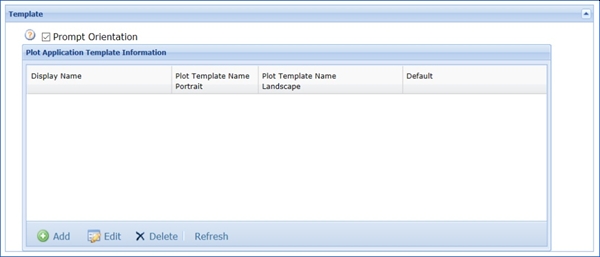
Fig: Plot TemplateNote: If the "Prompt Orientation" box is ticked, two templates (portrait and landscape) are required for the plot application. If the box is unticked, only one template is required. - Select the Prompt Orientation check box.
- To create a template, click the Add button.
Note: If the "Prompt Orientation" is disabled, the "Display Name" cannot contain the words "landscape" or "portrait".
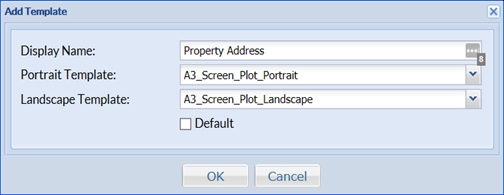
Fig: Add TemplateA plot application can be associated with several templates.
- Define the Template:
- Display Name: Enter a name that uniquely identifies the plot template.
- Portrait Template: Select the Portrait template from the drop-down list.
- Landscape Template: Select the Landscape template from the drop-down list.
- Click the OK button to add the template.
- Save the plot application by selecting the Save option on the top right corner of the Plot Application interface.
enPlot Application Field
Plot Fields correspond to the dynamic text items that were configured in the template via the Plot Template Editor.
- Select the saved plot application from the Plot Application drop-down list.
- Select Field from the Plot Application list.
- Each field (tag in the PTE) must be configured by selecting it and clicking on Edit.
The field Scale, for example, will be populated with the scale selected by the user in the Plot Application dialog box (Plot scale).
- The Plot Fields should correspond to the dynamic text items that were configured in the template via the Plot Template Editor. The plot fields can be added one at a time by choosing the Add option or automatically populated by choosing the Populate Tag option.
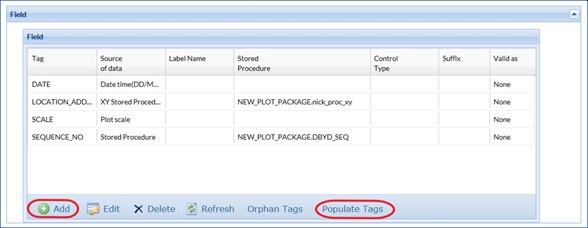
Fig: Populating Plot Fields with Plot Template Editor Items - To add a new field, click on Add.
A dialog should pop-up and the user should then populate the information accordingly. A variety of options will be available within this dialog and a description of these will be outlined below:
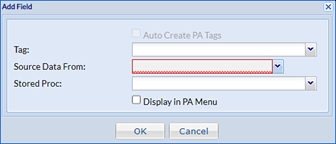
Fig: Stored Procedures Fields - Select the drop down on Source Data From and select either of the options:
- Menu: Show a text box for you to input value.
- Date: Show current date for the field with the format: DD/MM/YYYY which is from the IIS server’s date.
- Date Time: Show current date time for the field with the format: DD/MM/YYYY HH:MM:SS which is from the IIS server’s date.
- Plot Scale: Show the map’s scale for the field.
- Stored Procedure: Show the list of STOREDPROCNAME in table EN_PA_STORED_PROCS (whose SPTYPE is STD whose parameters must be inputID – input with type integer; outvalue – output with type varchar2).
- XY Stored Procedure: Show the list of STOREDPROCNAME in table EN_PA_STORED_PROCS (whose SPTYPE is XY whose parameters must be Lon – input with type integer; Lat---input with type integer; outvalue – output with type varchar2).
- Display List Stored Procedure: Show the list of STOREDPROCNAME in table EN_PA_STORED_PROCS whose SPTYPE is DISPLIST (whose parameters must be inputID – input with type integer; outList – output with type varchar2).
When selecting the Display in PA Menu check-box, then the user is required to define the relevant parameters:
Note: By ticking the check-box for Display in PA Menu for a specified field , when the user selects a plot application to apply to selected map objects, they can manually enter more meaningful and descriptive text to overwrite the text entry that is auto-populated in the text box adjacent to the Tag value defined for the field. - Label Name: The label displayed next to the text box.
- Control Type: This value relates to EN_PA_FIELDS.VALUE_CTRL_TYPE. It defines what type of control is to be loaded on the plot app window e.g. TEXTBOX. For TEXTBOX the plot app window will display an input text box along with its associated label name. The value entered will be passed to the plot template.
- Size: The width of the text box.
- Number of Lines: Defines whether the box is single or multiline text.
- Suffix: Allows entering a string that will be added to the end of each title.
- Max Number of Chars: Defines the length of the title.
- Validate as: Allows the text to be validated as numeric or phone/fax formats. By ticking the Mandatory option, the user is required to always fill in the title information.
If Stored Procedures, XY Stored Procedure or Display List Stored Procedure is selected then you will need to select the stored procedure from the drop-down list next to Stored Proc.
Note on stored procedures: To use Stored Procedures please note the Procedure must be setup on the Plot Package within the Enlighten configured database. Once this is done then the stored procedure must also be added to EN_PA_STORED_PROCS table with the following format:
Fig: Stored ProceduresSP_ID STOREDPROCNAME SPTYPE Description Number field, start at 1 and number subsequently Package name.Procedure name STD Example 1 PLOTAPPS.Zoning STD - Click the OK button to save changes
enPlot Application Action
In the Plot Action section, the administrator can assign a plot action to the plot application, such as automatically sending out the plots via email directly from the plot engine.
- Select Action from the Plot Application list
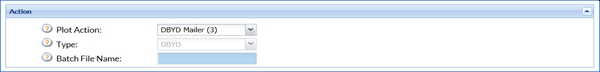
Fig: Plot Action - Select the plot action from the Plot Action drop-down list.
- The plot action Type will by default auto-populate, if not select a plot type from the Type drop-down list.
- Batch File Name will display the batch file associated with the plot action.
- Save the plot application by selecting the Save option on the top right corner of the Plot Application interface.
Please contact support@openspatial.com for more detailed information on Plot Action.
Plot highlight colours for lines, points and text labels can be customized to suit a user’s preferences. For more information please refer to the Plot Engine Installation Guide > Defining Styles of Selected Objects on a Plot section.
enPlot Group
In the Plot Group section, the administrator can create, delete and maintain Plot Groups and assign Plot Applications to plot groups.
To add a plot group the following steps can be followed:
- Navigate to Admin View > Map Administration > enPlot > Group.
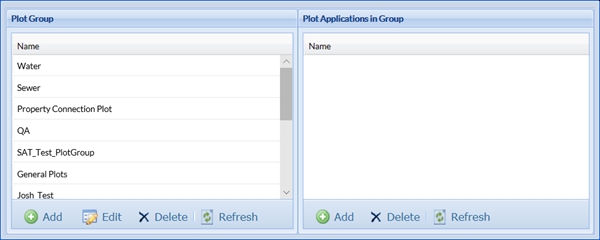
Fig: Plot Group - Click the Add button in Plot Group to add a new plot group.
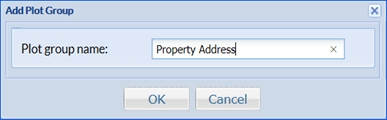
Fig: Add Plot Group - Enter a name that uniquely identifies the plot group in the Plot group name text box.
- Click the OK button to add the new plot group.
- Save the plot group by selecting the Save option on the top right corner of the Plot Group interface.
To add plot applications to plot groups the following steps can be followed:
- Navigate to Admin View > Map Administration > enPlot > Group.
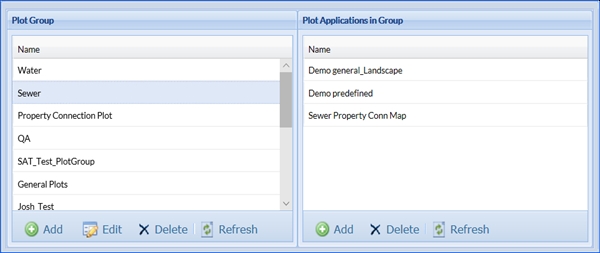
Fig: Plot Applications in Group - Select the group in Plot Group to add plot applications to.
- Click the Add button in Plot Applications in Group to add a new plot group.
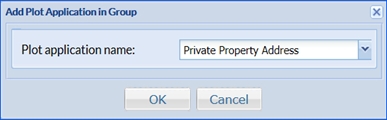
Fig: Add Plot Application in Group - Click the OK button to add the plot application to the plot group.
- Save the plot applications in the group by selecting the Save option on the top right corner of the Plot Group interface.
enPlot Search
In the Plot Search section, the administrator can configure the enlighten Searches to be used with Plot Applications.
Edit Plot Search Information
To edit a plot search the following steps can be followed:
- Navigate to Admin View > Map Administration > enPlot > Search.
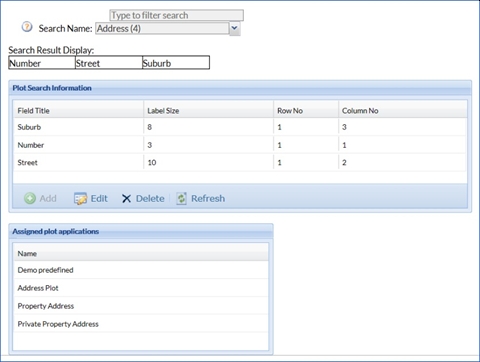
Fig: Plot Search - To filter the list of available searches type the search phrase in the Type to filter search text box.
- Select the search from the Search Name drop-down list.
- To edit plot search information select the field title in Plot Search Information and click the Edit button.
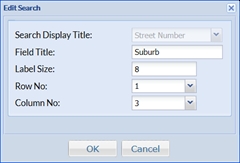
Fig: Edit SearchNote: Row and Column numbers define the position of the field in the plot dialog box. - Edit the plot search information and click the OK button.
- Save the plot search by selecting the Save option on the top right corner of the Plot Search interface.
Delete Plot Search Information
To delete Plot Search Information the following steps can be followed:
- Navigate to Admin View > Map Administration > enPlot > Search.
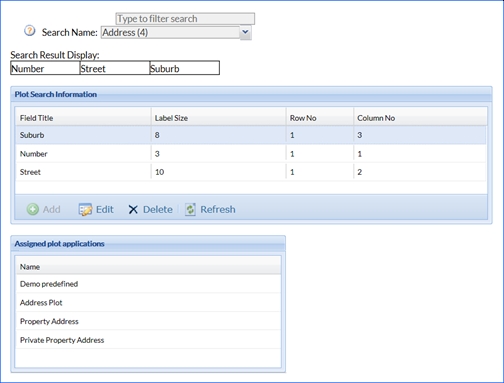
Fig: Delete Plot Search Information - To filter the list of available searches type the search phrase in the Type to filter search text box.
- Select the search from the Search Name drop-down list.
- To delete plot search information select the field title in Plot Search Information and click the Delete button.
- Save the plot search by selecting the Save option on the top right corner of the Plot Search interface.
Add deleted Plot Search Information
To add deleted Plot Search Information the following steps can be followed:
- Navigate to Admin View > Map Administration > enPlot > Search.
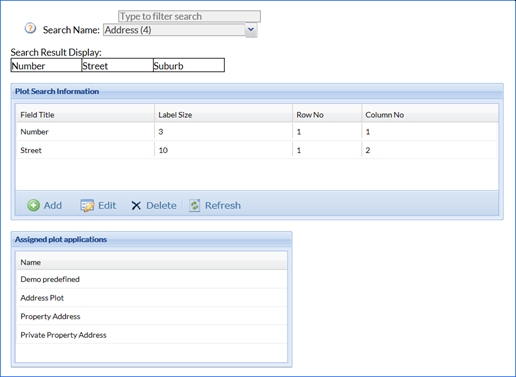
Fig: Add deleted Plot Search Information - To filter the list of available searches type the search phrase in the Type to filter search text box.
- Select the search from the Search Name drop-down list.
- To add deleted plot search information select the field title in Plot Search Information and click the Add button.
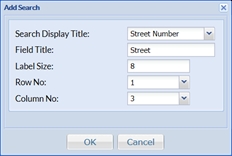
Fig: Adding deleted Plot Search Information - Select the title from the Search Display Title drop-down list.
- Enter a name that uniquely identifies the field title in the Field Title text box.
- Select a row number from the Row No drop-down list.
- Select a column number form the Column No drop-down list.
- Click the OK button to add the deleted plot search information to the Plot Search Information.
- Save the plot search by selecting the Save option on the top right corner of the Plot Search interface.
enPlot Action
In the Plot Action section, the administrator can create and maintain post-plot actions.
Add Plot Action
To add plot actions the following steps can be followed:
- Navigate to Admin View > Map Administration > enPlot > Action.
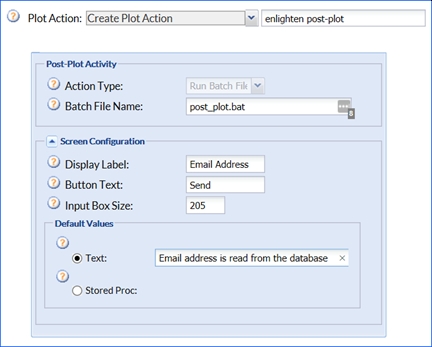
Fig: Create Plot Action - Select Create Plot Action from the Plot Action drop-down list.
- Enter a name that uniquely identifies the plot action in the text box next to the Plot Action drop-down list.
- Define Post-Plot Activity:
- Action Type: The plot action type.
- Batch File Name: Name of the batch file to be executed.
- Define Screen Configuration:
- Display Label: The label to display on the plot action page.
- Button Text: The text to display on the button in the plot action page.
- Input Box Size: The text box size on the plot action page.
- Define Default Values:
- Text: The message to displayed in the plot action page.
- Stored Proc: Stored procedure to use for the plot action.
- Save the plot action by selecting the Save option on the top right corner of the Plot Action interface.
Edit Plot Action
To edit plot actions the following steps can be followed:
- Navigate to Admin View > Map Administration > enPlot > Action.
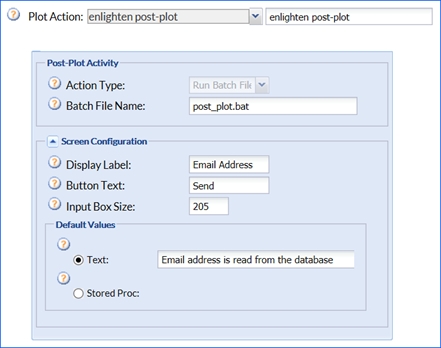
Fig: Edit Plot Action - Select the plot action from the Plot Action drop-down list.
- Edit the plot action and click the OK button.
- Save the plot action by selecting the Save option on the top right corner of the Plot Action interface.
Delete Plot Action
To delete plot actions the following steps can be followed:
- Navigate to Admin View > Map Administration > enPlot > Action.
- Select the plot action from the Plot Action drop-down list.
- Delete the plot action by selecting the Delete option on the top right corner of the Plot Action interface.
- Click the OK button to confirm deletion of the plot action.
Assign Permissions to Plot Applications
General Plots are configured in the same way as Pre-defined ones with the exception of not having to configure Searches and Plot Defaults.
To assign plot applications to users the following steps can be followed:
- Navigate to Admin View > User Administration > Manage User & Permissions > Functions.
- Select a user from Permissions Management.
- Select Functions from Permissions and scroll down to Plot Applns.
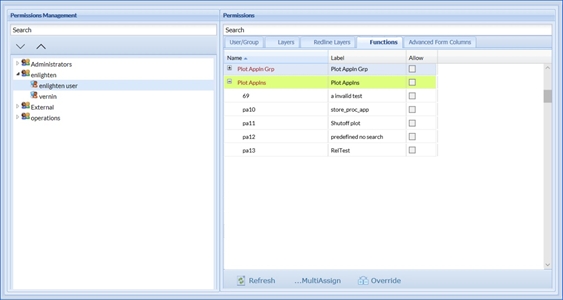
Fig: Assigning a Plot Application to a User - Check the Allow check-box of the plot application you want to assign to the user.
- Save the permissions by selecting the Save option on the top right corner of the Permissions Management interface.
Auto Scale in enPlot Applications
Requires Plot Engine version 4.0 with the following setting:
- This version of the plot engine implements an Auto scale function where the plot engine needs a text value to prefix the calculated scale with.
- Edit the file PlotEng
- ineMain.exe.config
- The value you enter is ONLY applicable to plot generated using Auto scale.
FROM: (or non-existent)

Fig: From Setting
TO:
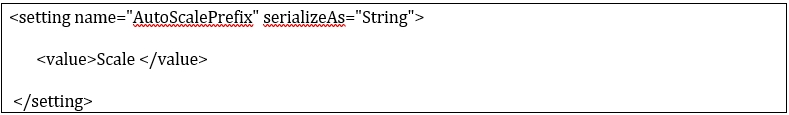
Fig: To Setting
Selections
The Selections Setup function allows the administrator to view and manage the selections created by the user in the map view. For more information, see the Spatial Functions section in the enlighten User’s Manual.
To view selections the following steps can be followed:
- Navigate to Admin View > Map Administration > Selections.
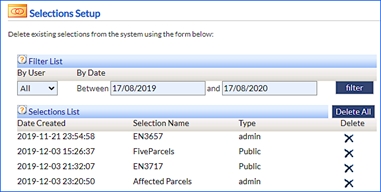
Fig: Selections SetupThe user selections can be filtered By User and/or By Date.
- To delete a selection, click the Delete icon next to its name, to delete all selections in the list click the Delete All option.
When a selection is deleted then the records will be removed from the database, however this varies on the selection type. If the selection type is a Private selection, then the records will be removed from the database accordingly. Public selections will however be retained as this may be relevant for other users, but both types can be deleted by the administrator.
Mail Merge
The Mail Merge Setup utility allows defining the information to be displayed in a mail merge document from Form setup for the Basic Form.
To activate the Mail Merge function from a Basic Form, first select the mail merge button from the Basic form set up.
To define the information that will appear when creating a mail merge document for a layer the following steps can be followed:
- Navigate to Admin View > Map Administration > Mail Merge.
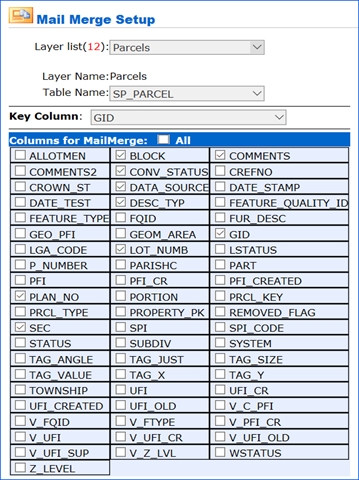
Fig: Mail Merge Setup - Select the layer from the Layer list drop-down list that you wish to define mail merge information for.
Note: Only the layers which you have ticked the mail merge box option, during the Show Info setup, will display this information. - Select the table from the Table Name drop-down list you wish to generate the mail merge information document for.
For example, you can define a mail merge document showing information on Parcel Ownership when querying the Parcel layer.
- Define Columns for MailMerge:
- Select a Key Column (primary identifier) from the drop-down list, in most cases, this will be the GID column.
- To select all columns, tick the All option checkbox.
- OR Tick one or more Columns that you wish to display in the mail merge document for the selected layer
- Click Save to save the changes.
Publish Layers and Forms
The Publish Layers and Forms tool is used to update the enlighten database with the latest layer information from MapGuide Open Source (MGOS) and maintain the advanced and basic forms associated with it. This should be used each time that MapGuide is updated or when forms have been created or altered. This will ensure that enlighten has access to the latest layer information created in MapGuide.
Save Layer Information
To save layer information to the database the following steps can be followed:
- Navigate to Admin View > Map Administration > Publish Layers and Forms.
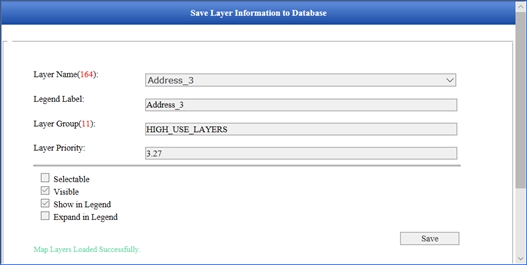
Fig: Save Layer Information to Database - To save all the layer information to the database click the Save button.
Note: It is possible to browse through the layers to check that they are consistent. Once complete a message will be shown saying that the layer information has been saved to the database. If any errors occurred while saving the layer information to the database a list of errors will be shown.
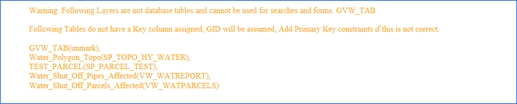
Fig: Save Layer Information to Database message
Validate Form Information
Validate form information will list all the changes to the forms that have not yet been saved to the database. These include:
- Orphan Forms: When layers have been altered or deleted in existing forms.
- Changed Forms: When columns have been altered or deleted in existing forms.
- Suspicious Form Definition: This check flags duplicate ID fields amongst a common column between the spatial and attribute tables which have been configured in a Show Info form.
To validate form information the following steps can be followed:
- Navigate to Admin View > Map Administration > Publish Layers and Forms > Validate Form Information.
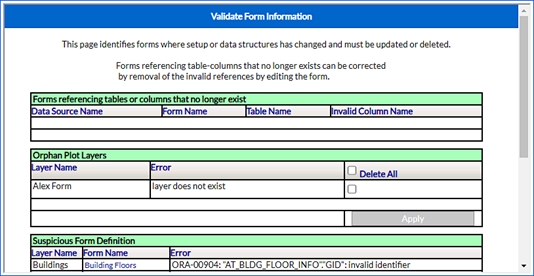
Fig: Validate Form Information - To delete orphan forms, select one or more instances and click on the Apply button.
- To confirm the deletion of orphan forms, click on the OK button.
- To export forms referencing tables or columns that no longer exist click the Export to CSV button.
Integration
The Integrations area is where you specify the details for how enlighten sends data to and/or receives data from third-party applications. Integration configurations to the following external systems are managed here:
- Aquarate
- Authority
- Dataworks
- Proclaim
- Generic URL and Command Integration
When using Integrations, it is essential to ensure the Enlighten Administrator has the latest Integration versions configured. If there are older integration versions applied, then the following error will be displayed – "Latest integration components are not installed".
Integrations can be split into two categories:
- Outgoing integrations: Involve enlighten sending data to a target system.
- Incoming integrations: Involve external systems sending data to enlighten.
The documentation below is split into these two broad categories of integrations.
Outgoing Integration
Outgoing integrations are integrations in which enlighten sends data to a third-party application. Configuration and customization of these integrations occur in the Modules Maintenance and Function Maintenance administration areas of enlighten. The details of these are listed below.
Modules Maintenance
Modules Maintenance is used to define the list of systems that you want enlighten to integrate with.
To create a new integration module the following steps can be followed:
- Navigate to Admin View > Map Administration > Integration-> Modules Maintenance.
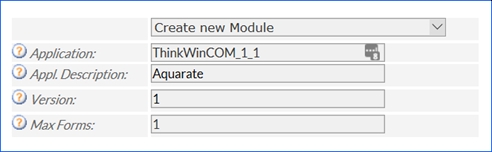
Fig: Create New Module - Select Create New Module from the Application drop-down list.
- Define Module Maintenance as follows:
- Application: Enter the name of the application to which you will be integrating. If integrating with Proclaim, Dataworks, Authority, or Aquarate, reserved names must be entered here:
- To integrate with Aquarate: enter ThinkWinCOM_1_1 as the application name.
- To integrate with Authority: enter encauthority as the application name.
- To integrate with Dataworks: enter enbdataworks as the application name.
- To integrate with Proclaim: enter proclaim as the application name.
- For generic URL and command integrations, any meaningful name can be used here. This name will be used to reference the integration in the generated XML file.
- Appl. Description: Enter a description for the application. This description should be a user-friendly name for the application, such as "Aquarate" or "Authority". This is the name that will be used to refer to this integration in the user environment and the Function Maintenance administration screen.
- Version: Enter the version number of the application enlighten is being integrated with.
- Max Forms: Enter the number of forms that can be simultaneously processed by the target application.
- Application: Enter the name of the application to which you will be integrating. If integrating with Proclaim, Dataworks, Authority, or Aquarate, reserved names must be entered here:
- To save the module press the Save button.
Function Maintenance
Function Maintenance is where you define the specific behavior of an integration.
To define an integration function for a target application the following steps can be followed:
- Navigate to Admin View > Map Administration > Integration > Function Maintenance.
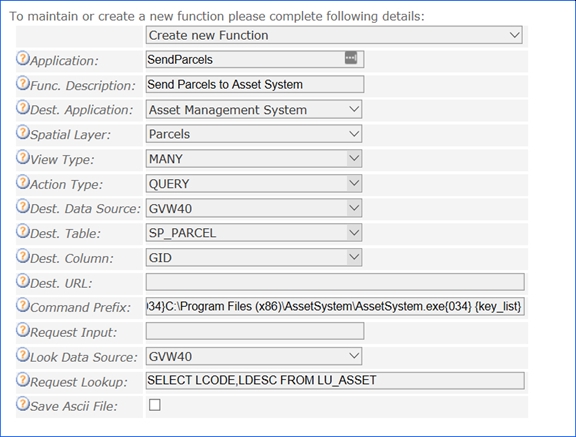
Fig: Functions of Licensed Integration Modules - Select Create new Function in the Function drop-down list.
- Define the Function Maintenance:
- Application: Type a name for the function. This is the name that will be stored in the generated XML file.
- Func. Description: Enter a description for the function. This is the name that will be presented to users in the integration pane of the enlighten user environment and in the Assign Functions to Users administration page.
- Dest. Application: Select the name of the target application in the Dest. Application drop-down. The names that appear in this dropdown are the descriptions you gave the modules in the Modules Maintenance administration screen.
- Spatial Layer: Choose the layer on which selections will be made in enlighten.
- View Type: Select the number of objects that will be sent to the target application simultaneously. The options available are ONE or MANY.
- Action Type: QUERY is the only available option.
- Dest. Data Source: Select the data source from which the attribute data will be sent.
- Dest Table: Select the table that contains the attribute information that will be sent to the target application.
- Dest. Column: Select the column from the destination table that contains the attributes that will be sent to the target application
- Dest. URL: If you are configuring a URL integration, enter the destination URL here. Entering something here will cause a browser to be opened at the entered URL when the function is run in the user environment. If you wish to pass the attribute values contained in the Dest. Column of the integration function to the target URL, include the {key_list} parameter in the URL. This will append a comma-separated list of the attribute values to the URL.
- Example syntax: http://server/website?{key_list}
If you use the {key_list} parameter in the Dest. URL, an XML file will not be created as part of the integration process. It is assumed that {key_list} will pass all the required information to the destination URL, so an XML file is not required.
- Example syntax: http://server/website?{key_list}
- Command Prefix: If you are configuring a command integration, enter the command to be executed in the Command Prefix text box. This command will be executed when the function is run from the user environment.
You cannot populate both the "Command Prefix" and "Dest. URL" fields. If both are populated, "Dest URL" will take precedence and "Command Prefix" will be ignored. - The syntax required to run a command is the same as that used on the windows command line E.g.: application.exe argument1 argument2
If you need to pass the attribute values contained in the Dest. Column of the integration function to the target application, use {key_list} as an argument to the command. This will pass the attributes to the application as a comma-separated list.
- Example syntax: application.exe {key_list}
If the command to run the application contains spaces you will have to encompass it in double quotes, just as you would have to if running the command from the windows command line. However, because of how the command is stored in the XML file, you cannot just put normal double quotes around it. You must instead use the ASCII code for double quotes in curly brackets, i.e. {034}.
- For example: {034}C:\Program Files (x86)\Application Folder\application.exe{034}
- The syntax required to run a command is the same as that used on the windows command line E.g.: application.exe argument1 argument2
- Request Input: Enter a prompt for any additional information that must be sent to the target application in the Request Input text-box. This prompt will be presented to users in the user environment, and they will be required to manually enter the additional information. This is currently only used by Authority.
- Look Data Source: Specify the data source where the required lookup table resides. This is currently only used by Authority. All other integrations will ignore this setting.
- Request Lookup: Enter a SQL statement to select columns from the above data source that will be used as lookup columns in the integration. Enlighten requires two columns for a table to be used as a lookup table: LCODE and LDESC. LDESC must contain the description of the lookup value. LCODE must contain the corresponding coded value. The value from the LCODE field will be written to the integration XML file, while the value from the LDESC field will be displayed to users in a drop-down in the user environment. To display lookup values from the data source, the SQL statement must be formed having aliases for the fields LCODE and LDESC. The variable {OVERRIDE_DISPLAY_VALUE} can be used to display only the lookup values for the desired column. Note: The "DISPLAY_VALUE" displays the description next to the code.
- For example: SELECT GID AS LCODE, PARCEL ADDRESS AS LDESC FROM SP_PARCEL WHERE GID = {OVERRIDE_DISPLAY_VALUE}
In this example, the PARCEL ADDRESS will be displayed instead of the GID for the selected parcels in the Integration Manager for the selected application.
- For example: SELECT GID AS LCODE, PARCEL ADDRESS AS LDESC FROM SP_PARCEL WHERE GID = {OVERRIDE_DISPLAY_VALUE}
- Save Ascii File: If the target application requires attribute information in an ASCII file, tick this checkbox. This is currently only used by Authority. All other integrations will ignore this setting.
- To save the integration function Press the Save button.
Incoming Integration
Incoming integrations are integrations in which a third-party application sends data to enlighten via a URL. External applications can access the following enlighten functionality through this mechanism:
To do this, the external application must open a browser with the following base URL: http://server/website/IntegrationLogon.aspx?
Additional parameters must be appended to this URL to specify the enlighten functionality required. Details of these parameters are listed below.
Search Integration
To initiate an enlighten search from an external application using a URL, the following parameters must be appended to the base integration URL listed above. These parameters are:
- Search name: This needs to be set to the name of the search to be executed.
- The Search name is as configured in Admin View > Map Administration > Search and is displayed in the drop-down box in the user interface.
- The search name must be specified in the URL WITHOUT any spaces, round brackets, dots, slashes or dashes.
- Search inputs: These are the input display names and values that you want to search for.
- Search inputs are specified, starting with an ampersand (&), then the input display name(s) configured in Admin View > Map Administration > Search, then an equal sign "=" and then the search value.
- Input display names must be specified in the URL WITHOUT spaces, round brackets, dots, slashes or dashes.
- Input display names can be replaced by the following generic names: Input1, Input2 etc.
- Input display names are NOT to be the underlying database column name.
For example, to build a URL to run a search in enlighten named Search by Address that has the following two inputs, Street Name and Street Number you must append the following parameters to the base integration URL:
- Search=SearchbyAddress
- StreetName=Smith
- StreetNumber=10
The completed URL will resemble the following:
- http://server/website/IntegrationLogon.aspx?search=SearchbyAddress&StreetName=Smith&StreetNumber=10
Or if you choose to use the generic input names, the following:
- http://server/website/IntegrationLogon.aspx?search=SearchbyAddress&Input1=Smith&Input2=10
Selection Integration
Starting enlighten and selecting some objects via URL can be achieved in two different ways: by passing a comma-separated list of IDs, or by specifying an XML file containing a list of objects to select.
To select objects by passing a comma-separated list of IDs to a browser requires the following parameters to be appended to the base integration URL listed above:
- Application name: This must be set to the name of the integrating application as specified in the Modules Maintenance admin screen.
- Function name: This must be set to the name of the function as specified in the Function Maintenance admin screen.
- Layer name: This is the name of the layer that contains the objects to be selected.
- Column name: This is the name of the database column to be queried.
- Values: This is a list of comma separated values indicating the objects to select.
For example, to start enlighten and select two parcels with GID’s 6094111 and 6107752, you must append the following parameters to the base integration URL:
- application=Aquarate
- function=SelectParcels
- layer=Parcels
- column=GID
- keys=6094111,6107752
The completed URL will resemble the following:
- http://server/website/IntegrationLogon.aspx? application=Aquarate&function=SelectParcels&layer=Parcels&column=GID&keys=6094111,6107752
Using an XML file to select objects in enlighten through a URL requires the following parameters to be appended to the base integration URL listed above:
- XML message: This must be set to the name of the XML file containing the list of objects to select. enlighten will look for this file in the location specified by the INTEG_XML_NETFOLDER setting in EN_SETTINGS. If the XML file cannot be found in this location, it will check the location specified in the enConnect configuration file (If you have enConnect installed). The XML file must conform to the integration XML format listed at the end of this section of the manual.
For example, to start enlighten and select parcels listed in an XML file named ParcelList.xml that is stored at the server location specified by INTEG_XML_NETFOLDER, you must append the following parameter to the base integration URL:
- xmlMessage=ParcelList.xml
The completed URL will resemble the following:
- http://server/website /IntegrationLogon.aspx?xmlMessage=ParcelList.xml
Zoom to Coordinates Integration
Starting enlighten and zooming to a specified area via URL can be achieved by appending the following parameters to the base enlighten integration URL:
- Coordinates: You must specify the coordinates of the upper left and lower right corners of the target area. The coordinate values must be separated by the pipe ("|") symbol.
- Scale: You must specify the desired zoom scale.
For example, to start enlighten and zoom to an area with upper left coordinates of 1, 1 and lower right coordinates of 400, 400 at a zoom scale of 1:500.
Append the following parameters to the base integration URL:
- Coords=1|1|400|400
- Scale=500
The completed URL will resemble the following:
http://server/website /IntegrationLogon.aspx?coords=1|1|400|400&scale=500
XML Format Integration
enlighten’s XML format integration is as follows:
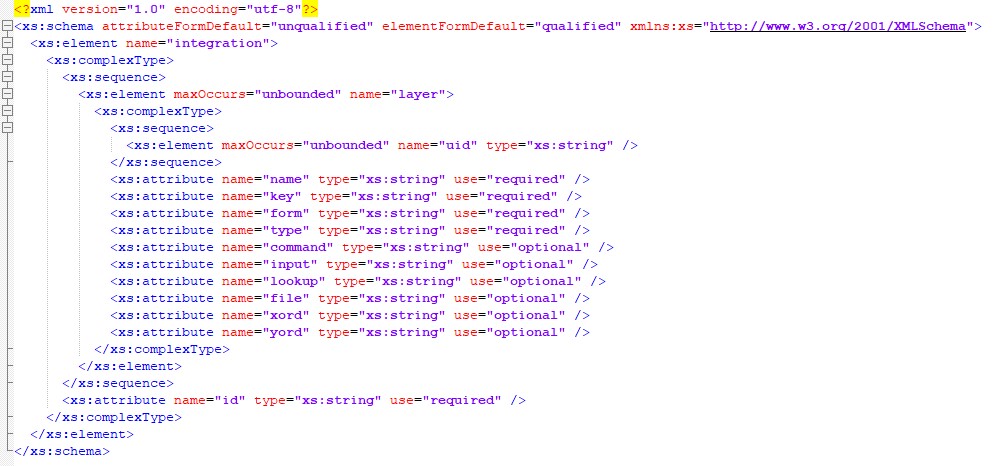
Fig: enlighten’s XML format integration
Property System Matching
Property System Matching is used to match addresses between enlighten and third-party applications.
If the automated matching needs to be manually run, then this can also be done through the scheduled task. Two options are available in the Property System Matching Tab:
Manual Match
Running a Manual matching of the remaining unmatched addresses or editing of existing links.
To set up a manual match the following steps can be followed:
- Navigate to Admin View > Map Administration > Property System Matching > Manual Matching.
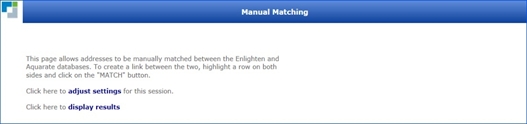
Fig: Manual Matching - Click on the link labeled adjust settings.
The displayed "Where clause" will display the last referenced filter applied during the last automated matching process. If modifying the "Where clause" filter all data is loaded as upper case, therefore all filter values entered will need to be entered as upper case. The columns available to filter upon will depend on each customer’s settings.
Note: Do not alter anything except the street prefix itself in the where clause, unless the user has advanced knowledge of SQL and wishes to perform further refinements to the records that are to be retrieved.
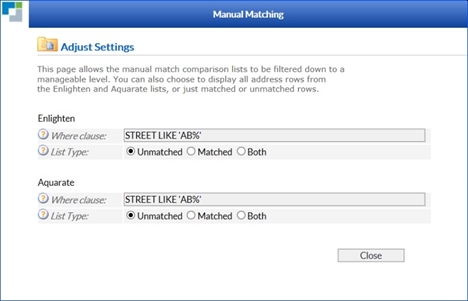
Fig: Adjust Manual Matching Settings - Define the List Type:
- Unmatched: Only addresses that do not match will be displayed.
- Matched: Only addresses that match will be displayed.
- Both: All matched and unmatched addresses will be displayed.
- Click on the Close button to apply the changes for this session only.
It is possible to use an OR to filter data however the entire clause must be enclosed in brackets. The following are some example filters:
Where Clause filter Expected Result STREET LIKE 'HUNT% Returns all streets that begin with the letters HUNT (PLAN LIKE '90%' OR PLAN LIKE '91%') Returns plans that begin with 90 or 91. Note the entire statement is enclosed in brackets (STREET LIKE 'HUNT%' OR STREET LIKE 'BECK%') Returns all streets that begin with the letters HUNT or BECK To view, the result of the unmatched street details click the display results button.
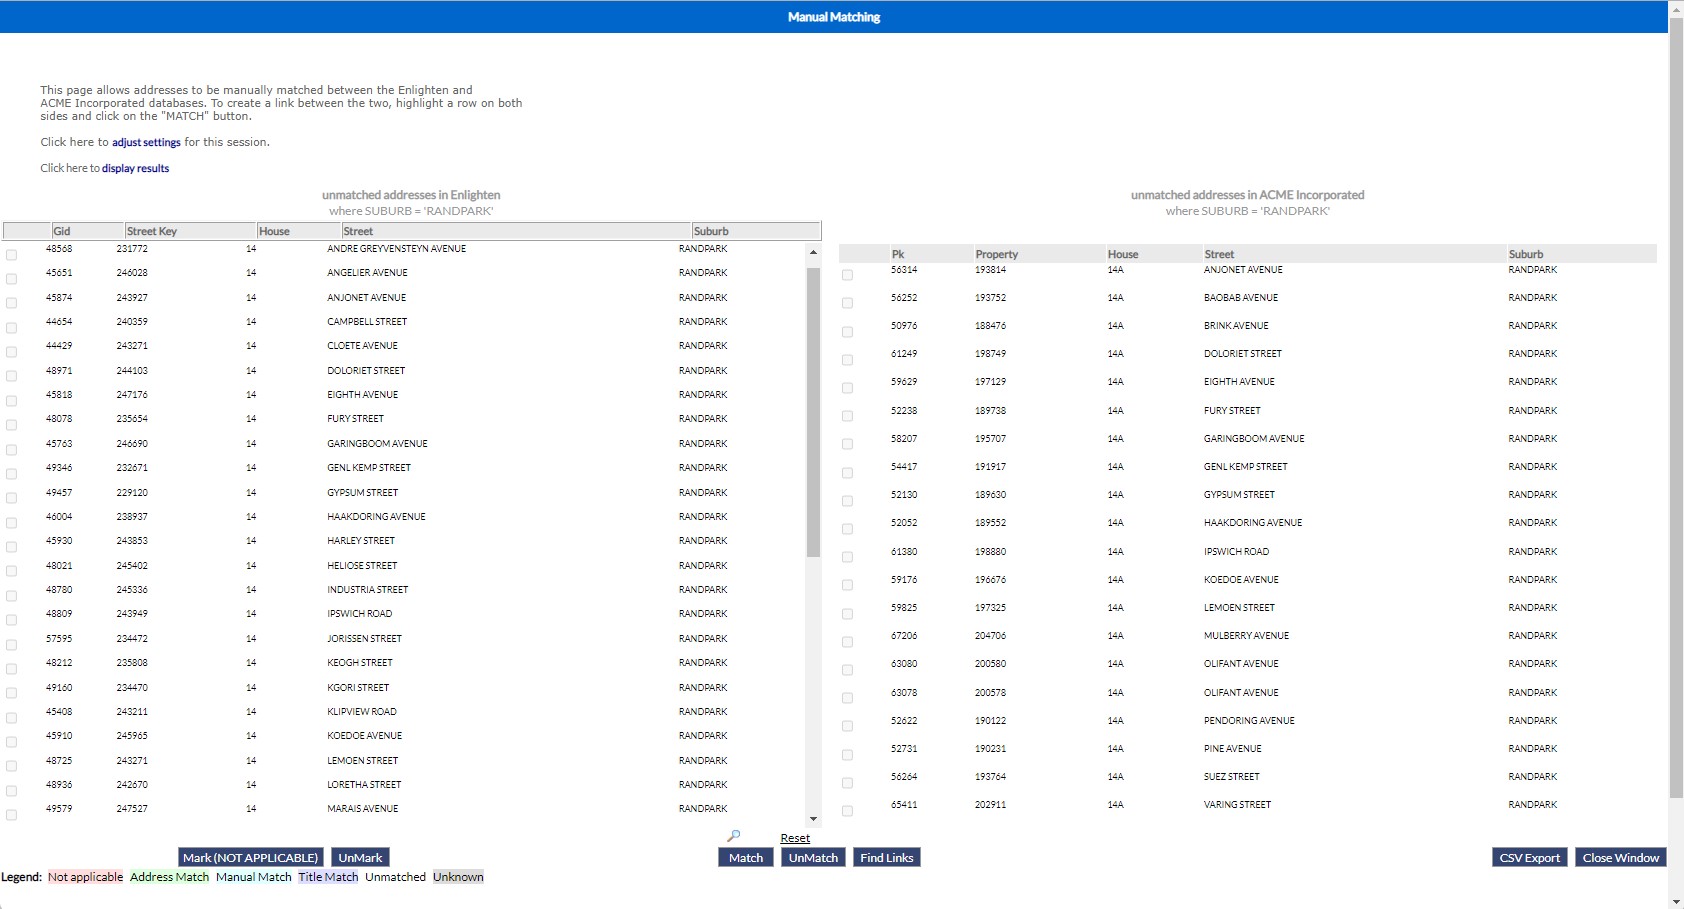
Fig: Manual Matching Table - To manually match up the left-hand side list with the right-hand side, click on a row from both lists.
Details for the row selected will appear in a box at the bottom of each list, the first line showing title information and the second line showing the key for the parcel/property record.
- Click on the Match button to update the database. SP_PARCEL.CONV_STATUS will be updated with an M value and will create a link in the table LNK_AQUA_MUN.
- When the database update was successful, both rows will change to the color green (Address Match)
- More information for the Munsys row can be obtained by clicking on the magnifying glass icon which is also at bottom of the list. This directs the map view in parent frame to zoom to the selected parcel.
- By clicking on the Show Info icon on the main toolbar a form will popup providing even more details. Additional forms can be created within enlighten for the layer to provide views to other tables including E.g. Aquarate tables if desired.
- To undo a matched pair that was done in error, click on the matching rows on both lists and then click on the UnMatch button. A successful update to the database will be confirmed if both rows change color from green to neutral (Unmatched).
- If a Munsys address does not apply, click on the Mark (NOT APPLICABLE) button. SP_PARCEL.CONV_STATUS will be updated with an NA value. To confirm that the update has completed, the Munsys row will change color to pink (Not applicable).
- To export the Address list to a CSV file, click the CSV Export button.
- When matching is complete, click the Close Window button.
Export CSV File
This screen allows the enlighten title information to be exported to a CSV file for later importation into a third-party application.
The intention is to update lot/plan detail into the third-party application E.g. Water billing "Aquarate".
The default filename used for the generated CSV file will be "landvic_import.csv" but the user can override this when downloading it to their client machine.
To export the data the following steps can be followed:
- Navigate to Admin View > Map Administration > Property System Matching > Export CSV File.
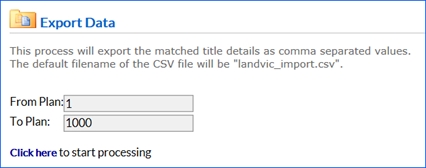
Fig: Export Data - Define the number of plans to export From Plan and To Plan.
- Export the matched data by clicking on Click here, a progress bar will appear while the data is exporting.