Known Issues and or Limitations
enPlot – Does not display plots
Problem 1:
After enlighten was updated from an previous version and the enPlot application is used for the first time in enlighten you receive the below error indicating that there are no plot groups assigned to the enPlot application:
if (data.Groups.length === 0 || data.Apps.length === 0) {alert("No plot applications found or assigned");
Solution for Problem 1:
Create an enPlot group, for more detailed information on creating a plot group please refer to enPlot Group.
Problem 2:
There is a known issue with the plotting of Redline Objects on Predefined Plots. When the user attempts plotting redline features via a predefined plot, these redline features do not display on the plot.
If there are any display issues pertaining to specific task panes or pop-up windows, then please feel free to contact us on support@openspatial.com for further investigations on this issue.
House Keeping
enlighten generates a number of temporary files particularly when running Integrations, Mail Merge, and Export to CVS functions.
In the enlighten directory the folder HouseKeeping contains batch file Delete_Temp.bat that will automatically clear the temporary files generated by:
- enlighten Logging
- Show Info forms
Windows Task Scheduler can be configured to automatically run the batch file and delete the following temp files:
- All XML messages
- Mail-Merge or CSV Export documents
To set up the Windows Task Scheduler, open it from Control Panel> Scheduled Tasks> Add Scheduled Task. When asked for selecting the program that Windows has to run, browse to the batch file Delete_Temp.bat in the website HouseKeeping folder and then specify the frequency and day-time for the task to be run.
enlighten also saves temporary data in dedicated temporary tables in the spatial database. Sometimes this data is not removed and remains behind. If enough activity is performed the next sequence can roll back and there is potential for a collision with the remnant data resulting in processes failing when saves are attempted to the database. Running new batch file ‘Monthly_DB_Cleanup.bat’ will clean up all temporary data in the database as well as reset the network trace sequence and the shut off sequence. The following functions make use of these temporary tables:
- Shut off Reports
- Redlining
- Searches
- Address matching
- User admin pages
- Publishing Layers
- Network Trace
The batch file also references script files "Reset_Trace_Sequence.sql" and "Reset_Shut off_Sequence.sql" when resetting the trace and shut off sequences. It should be run outside office hours, the frequency that it should be run is determined by how quickly the sequences are consumed in sequence OS_SHUT OFF_ID. The initial upper limit for this sequence was set to 10000 but has now been upwardly revised to 40000.
To customize the location of your log root folder you need to access the Infrastructure Map Server Site Administrator (http://[ server name] /mapserver2015/mapadmin/login.php).
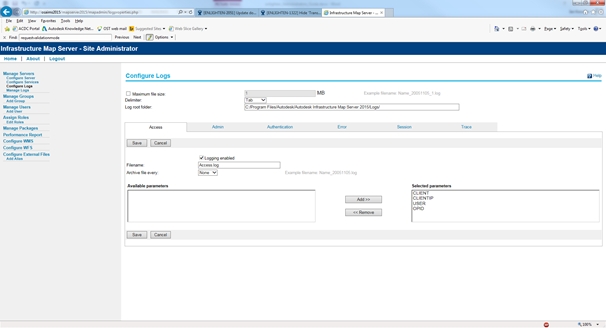
Fig: Configure Logs
Select the "Configure Logs" tab on the left of the screen under "Manage Servers". An option will appear on the screen "Log root folder". This is the location the temporary log files will be stored.
Logs can be configured using the log4net.config file which is available in the root directory of enlighten. This appears as below. For more information see http://logging.apache.org/log4net/release/manual/configuration.html
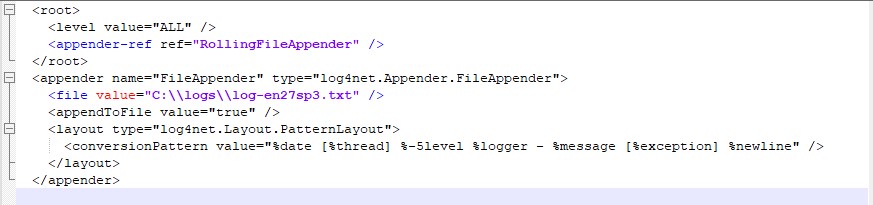
Fig: Log Configuration
Shut Off Reporting
Shut off reporting is used to track display shut off events along a network. Below is some general information about shut off reporting followed by a guide on configuring shut off events in enlighten.
General Shut Off Reporting Information
To save the results of a Network Trace the user can use the "Shut Off Reporting" functionality described in the enlighten User's Guide.
Autodesk Infrastructure Studio may need symbol configuration so that the symbols used by shut off reporting to mark the position of the pipe is available in enlighten.
By default in the EN_SETTINGS table, the marker is configured to use the symbol "Markers-Cross" (SHUT_OFF_MARKER as setting variable). Its default size is also set to 5 (via setting SHUT_OFF_MARKER_SIZE). These settings can be modified after installation at any time (Please refer to the database administration section of this manual).
When the Shut Off Save button is clicked and no errors occur, the following three tables are updated:
- ENS_WATREPORT will contain the event details and the location of the event set by the user (see enlighten Users’ Guide for more information);
- EN_WATREPORT_WATSERV will contain the details of the water service connections. This will not necessarily involve all the nominated connections on the map because only those with a water category the same as the requested event category will be selected;
- EN_WATREPORT_WATPIPE is updated with details of the water pipes associated with the above water service connections.
Database triggers have been configured for the above three tables that will create log entries in table ENS_WATREPORT_OPERATIONS when either an INSERT or UPDATE or DELETE action is performed. Therefore there will at least be INSERTS in the operations table as new shut off events is recorded. Finally, some lookup tables are required to populate the lookup lists for Shut Off Reporting as follows:
- Report types (EN_LU_REPORT_TYPE)
- Event Types (EN_LU_EVENT_TYPE)
- Planned (EN_LU_EVENT_PLAN)
- Categories (LU_WMS_WATCATEGORY)
The same structure applies to Shut Off Reporting for Sewer Network Trace. Only the EN_LU_EVENT_TYPE table has to be updated with the type definition specific to each organization. The event types for sewer will have an LTYPE value equal to S, while this will be empty for water event types. To insert new look-up values for Sewer, the enlighten Administrator will add a new LCODE, LVALUE, and LTYPE to the EN_LU_EVENT_TYPE table below:
| LCODE | LVALUE | LTYPE |
| 1 | Burst | |
| 2 | Leak | |
| 3 | Pressure Loss | |
| 4 | New Connection | |
| 5 | Maintenance / Replacement | |
| 6 | Other Failure | |
| 7 | Other | |
| 8 | Blockage | S |
| 9 | Overflow | S |
| 10 | Maintenance / Replacement | S |
| 11 | Pipe Breakage | S |
| 12 | New Connection | S |
| 13 | Other | S |
The Shut Off saved information can be exported or displayed back in enlighten. Please find a configuration in the following section.
Configuring Display Shut Off Events in enlighten
Having saved the results of a Network Trace through Shut Off reporting, the enlighten Administrator has been asked to display them in enlighten. To do this, the administrator must create new layers in AIS.
To display the shut off event points in enlighten, five layers in total need to be created (see Create Layers) with the information from the table below:
| LAYER NAME | CORRESPONDING TABLE |
| Water_Shut_Off_Event | ENS_WATREPORT |
| Water_Shut_Off_Pipes_Affected | VW_WATREPORT |
| Water_Shut_Off_Parcels_Affected | VW_WATPARCELS |
| Water_Shut_Off_Pipes_Affected | VW_SEWREPORT |
| Water_Shut_Off_Parcels_Affected | VW_SEWPARCELS |
Theming your layer
To configure a symbol for your layer see adding a symbol in AIS.
These layers can be customized to depict the frequency of shut off events. You can theme this layer on the field ‘NUMBER_OF_BLOCKS’. The example below shows different colors for values defined in the number of blocks field. More information on theming layers is available from the Autodesk Infrastructure Studio Help.
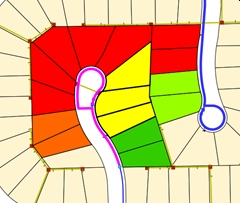
Fig: Themed Parcels on a Shut Off Report
Adding a Shut Off Report Group to the Map Definition File
Once all of the above layers have been created, we need to add them to the map definition file in MapGuide Maestro.
- Create a group and call it SHUT_OFF_REPORTS. See Adding Groups in Mapguide Maestro for more details.
- Add layers:
- Water_Shut_Off_Event
- Water_Shut_Off_Pipes_Affected
- Water_Shut_Off_Parcels_Affected
- Sewer_Shut_Off_Pipes_Affected
- Sewer_Shut_Off_Parcels_Affected
Case Studies
Case Study 1 - Relationships setup in Show Info Forms
When relationships are set up they allow the user to see attribute data from tables that are connected only through an intermediate table.
The example below will create a relationship between the Water pipes table and parcels table. When it is used in a Show Info form, it will allow you to view the data for all the parcels connected to a selected water pipe or vice versa.
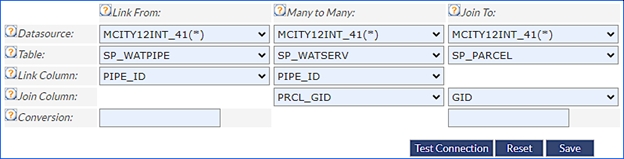
Three tables from the database will be used to create the relationship between water pipes and parcels.
- The first table is SP_WATPIPE
- The second table is SP_WATSERV
- The third table is SP_PARCEL
Table one has a column that is named PIPE_ID. Table two also has a column called PIPE_ID. This column is used to create a relationship between table one and two.
Table two has another column that is called PRCL_GID. Table three has a column called GID. The contents of these columns share values. So, the GID value is used to create a relationship between table two and table three.
Because table one and table three share columns with table two, it can be used as an intermediate table to connect them.
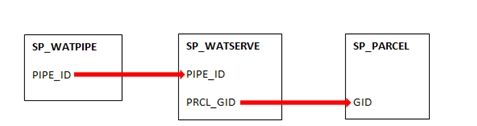
Fig: Intermediate Table
Creating a Relationship
To add this relationship in enlighten follow the steps outlined below:
- In the administrator screen select Map Admin.
- Select the Relationships tab.
- Add Relationship will open by default.
- In the Link From column:
- Select your Datasource from the drop-down list.
- Select Table SP_WATPIPE.
- Select Link Column PIPE_ID.
- In the Many to Many column:
- Select your Datasource from the drop-down list.
- Select Table SP_WATSERV
- Select Link Column PIPE_ID
- Select the Link Column PRCL_GID
- In the Join To column:
- Select your Datasource from the drop-down list.
- Select Table SP_PARCEL
- Select the Link Column PRCL_GID
- Select Save.
Using a Relationship in the Show Info Forms
Once this relationship has been created it can be used in advanced forms to display connected parcel attribute data when a water pipe is selected on the map, and a Show Info form is selected.
To set this functionality:
- Open the Administrators view.
- Select Map Admin tab.
- Select the Show Info option
- Select the Add Info option
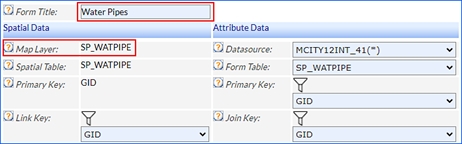
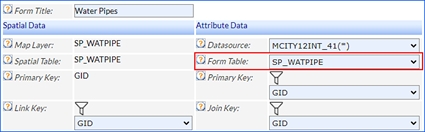
- Enter an appropriate title in the Form title field.
- For the Spatial Data column:
- Set the Map Layer as Water Pipes.
- The Spatial Table and Primary Key will automatically populate.
- Leave the Join Key for now.
- For the Attribute Data column:
- Select your Datasource.
- Set the Form Table to SP_PARCEL.
- Set the Primary Key and Join Key to GID.
- The Link Key field from the Spatial Data column, will automatically detect that a relationship exists between the tables and will read Join Key Found.
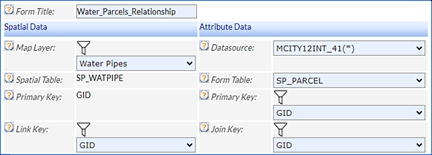
- Define the List View and Detail View as described in the Show Info section.
- The form must now be assigned to users.
- Permissions must be assigned to users.
Once the Show Info form has been created and appropriate permissions have been assigned the real functionality of relationships becomes apparent.
Advanced Forms User Environment Using a Relationships
An example of how this Show Info form is utilized by the user is included below:
- In the map view zoom in until you can see water pipes on the map.
- Select a water pipe that is connected to parcels via a service connection.
- Select Show Info option from the Main Toolbar.
- If the form you have created is not the first tab, click on the tab once to change the detail view, once this view has changed click on the tab again to see the information in the list view.
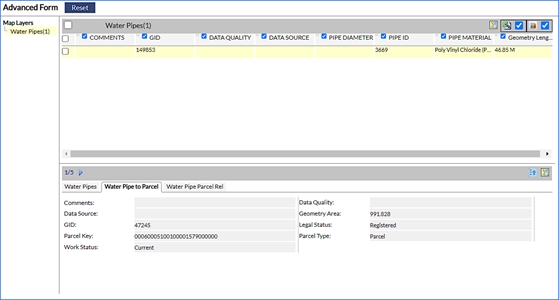
- The information displayed will be the parcel information you defined in the Show Info form setup page.
- The parcels whose information is displayed in the Show Info forms are the parcels that are connected to the pipe via a service connection.
- All Shoe Info form functionality is still available.
Case Study 2 - Setting up a Show Info form with a lookup drop-down list
Show Info forms can be set up to have information in the detail view editable in the user environment. This data can be set to use a drop-down list rather than free text.
This case study will provide a detailed example of how to set up a Show Info form in which the user can edit and save lookup data in the detail view.
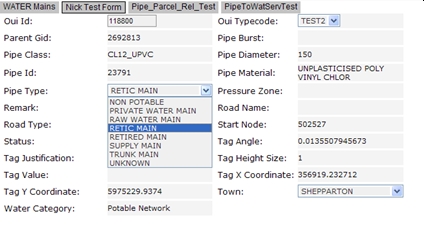
Adding a Lookup
- Create a lookup of the field you wish to edit.
- In this case we are expanding the codes for pipe material.
- The table SP_WATPIPE has a column called PIPE_MATRL
- The lookup table LU_WMS_PIPEMATRL has a column called LCODE which can be linked to the column PIPE_MATRL from the table SP_WATPIPE.
- The lookup table LU_WMS_PIPEMATRL also has a column called LVALUE which contains expanded information corresponding to the LCODES.
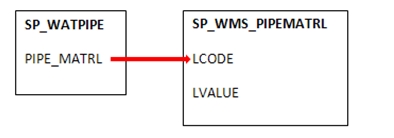
- Once the above information has been entered it will allow the expanded information to be visible in the detail section of advanced forms in the user environment.
- Enter the Administrators screen.
- Click on Map Admin.
- Click on Lookups.
This will by default take you to the Add Lookups screen. - In the column Link From Data:
- Select your datasource from the drop-down.
- Select table SP_WATPIPE.
- Select Code Column PIPE_MATRL.
- In the Join To Lookup column:
- Select the table LU_WMS_PIPEMATRL.
- Select the Code Column LCODE.
- Select the Description LVALUE.
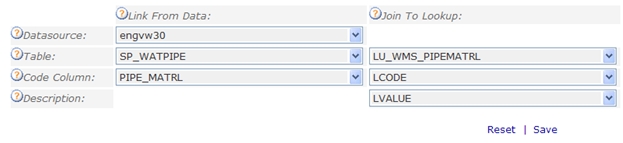
- Click Save.
- The form then needs to be set as editable, see the section below: Editing a Show Info form.
Case Study 3 - Editing an Show Info form
- Navigate to Admin view > Map Administration > Advanced Forms > Edit / Delete Form.
- Click on the Layer drop-down > and select the Layer where the form is defined on for editing.
- Click on the Edit icon next to the Advanced Form Name.
- Click on the Edit check-box next to the column required to be Edited in the Define Detail View.
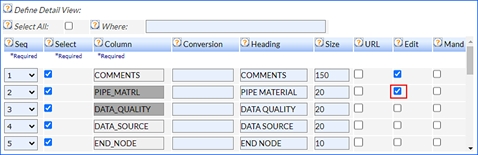
- Click on Save when done
Assign Layers
- Navigate to Admin View > User Administration > Manage User & Permissions.
- Click on the User or Group, then click on Layers tab.
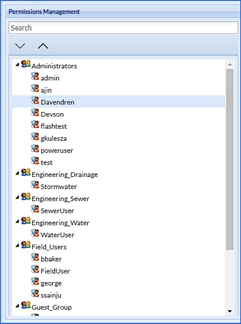
- Select the Layer which the Advanced Form references e.g. Water Pipes, and tick it on.
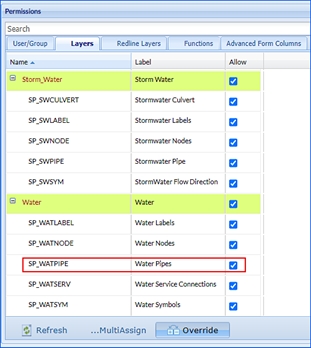
- Click on Save.
Assign Functions
- Click on the Functions tab.
- Select the User you want to assign functions to.

- Navigate to the Name of the corresponding Label and tick that on.
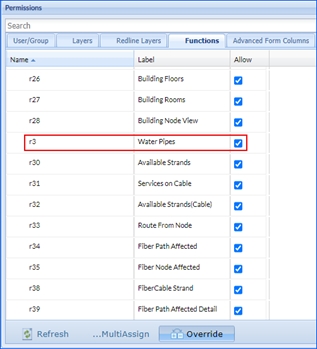
- Ensure that Permission to save changes is checked on the list e.g. Permission to save changes.
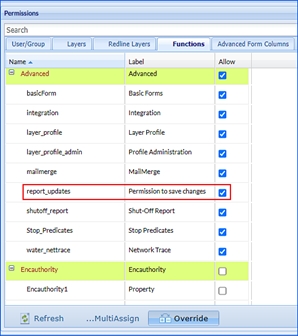
- Click on Save.
Assign Permissions
- Click on the Advanced Form Columns tab to Assign Permissions.
- Select the Datasource.
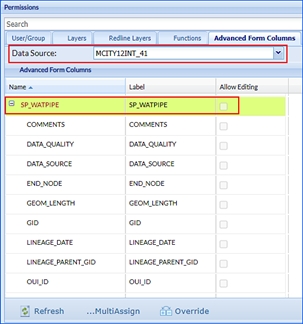
- Select the User or Group you want to assign permission to.
- Navigate to the Table from the field eg. SP_WATPIPE.
- Click on the Edit check-box next to the desired column, you wish to make editable eg. PIPE_MATRL.

- Click on Save.
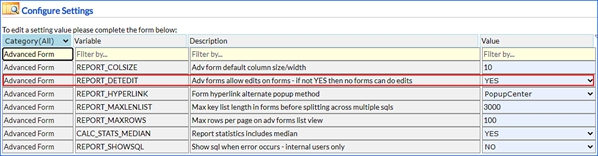
The user may need override permissions to perform this, which can be found in the earlier section of this Administrators guide. - In addition, a DB setting is required to be set to YES, to allow for the editing and saving changes. This setting is found in Site Settings > Configure Settings > REPORT_DETEDIT (Advanced Forms).
List of Functions Explained (Manage User & Permissions > Functions)
| Category | Enlighten functions | Label | Purpose |
| Admin | admin_all | Admin View | Allows administrator user to be able to manage and assign all Admin Functions |
| Admin | CheckLogInfo | Check Log Info | Gives permission for the user to view the log within the Enlighten log page (in admin view) |
| Admin | admin_log | Log Management | Allows Admin View > Log Admin to be available in Admin View |
| Admin | admin_map | Map Management | Allows Admin View > Map Admin to be available in Admin View |
| Admin | admin_site | Site Management | Allows Admin View > Site Admin to be available in Admin View |
| Admin | admin_user | User Management | Allows Admin View > User Admin to be available in Admin View |
| Advanced | Advanced | Advanced | Allows administrator user to be able to manage and assign all Advanced Functions |
| Advanced | buffer | Buffer | Allows user access to the Buffer command on the Advanced Toolbar |
| Advanced | custom_query | Custom Query | Allows user access to the Custom Query command on the Advanced Toolbar |
| Advanced | integration | Integration | Allows user to be able to view button for Integrations in Map View |
| Advanced | layer_profile | Layer Profile | Allows user access to the Layer Profile command on the Enlighten Toolbar |
| Advanced | mailmerge | MailMerge | Allows user to see button within Forms that enables creation from the form into Microsoft Word's mail merge format (able to be ingested via mail merge) |
| Advanced | measure | Measure | Allows user access to the Measure command on the Enlighten Toolbar |
| Advanced | water_nettrace | Network Trace | Allows user access to the Network Trace command on the Advanced Toolbar |
| Advanced | report_updates | Permission to save changes | Allows the user to make changes to specified fields which are editable within Show Info forms |
| Advanced | layer_profile_admin | Profile Administration | Allows user to be able to set Public Layer Profiles in Map View |
| Advanced | quick_plot | Quick Plot | Allows user access to the Quick Plot command on the Enlighten Toolbar |
| Advanced | shutoff_report | Shut-Off Report | Allows user to be able to view button for Shut-Off Report in Map View |
| Advanced | Stop_Predicates | Stop Predicates | Allows user to edit Stop Predicate values |
| Advanced | theme_layer | Theme Layer | Allows user to access the Theme Layer function on the Advanced Toolbar |
| enMerge | eMrgWF1 | Shut-Off, Network Trace | Allows user to be able to run a Network Trace where the results are used to create a Shut-Off Report |
| enMerge | eMrgWF2 | Shut-Off | Allows user to save a Shut-Off Report and then have the option to run a Plot with detailed results |
| enMerge | eMrgWF3 | Shut-Off Update | Allows user to select an existing Shut-Off Report and edit details before Plotting |
| Form | r1 etc. | [User Defined Label] | Anything in the form category has been created by the customer's admin user. It will allow access to the specified form |
| Layer Filter | lf1 etc. | [User Defined Label] | Anything in the layer filter has been created by the customer's admin user. It will allow access to the specified layer filter |
| Map | Map | Map | Allows administrator user to be able to manage and assign all Map Functions |
| Map | DrillDown | Drill Down Selection | Allows user access to the Drill Down function on the Advanced Toolbar |
| Map | editRedlines | Edit Redlines | Allows user to be able to view button for Redline Markups on the Main Toolbar |
| Map | enCapture | enCapture | Allows user to be able to view button for enCapture on the Advanced Toolbar |
| Map | enMerge | enMerge | Allows user to be able to view button for enMerge on the Advanced Toolbar |
| Map | layerFilter | Layer Filter | Allows user to be able to view button for Layer Filter on the Advanced Toolbar |
| Map | MaintainArtifacts | Maintain Artifacts | Allows user to be able to edit artifact attributes and remove artifact relationships via the Maintain Artifacts icon found on the Advanced Toolbar |
| Map | nearestN | Nearest Neighbour | Allows user to be able to view button for Nearest Neighbour on the Enlighten Toolbar |
| Map | notifyRedlines | Notify Redlines | Allows user to be able to notify / be notified of updates on an Assigned Redline Layer |
| Map | plotApps | Plot Applications | Allows user to be able to view button for enPlot Plot Engine icon on the Enlighten Toolbar |
| Map | redlinePan | Redline Panel | Allows user to be able to view Redline button in Map View and display Redline Panel in task pane |
| Map | RegisterArtifacts | Register Artifacts | Allows user to be able to view button for Register Artifacts on the Advanced Toolbar |
| Map | searchPan | Search Panel | Allows user to be able to view Search button in Map View and display Search Panel in task pane |
| Map | selections | Selections | Allows user to be able to view Saved Selections button on the Enlighten Toolbar |
| Map | showInfo | Show Information | Allows user to be able to view button for Show Information on the Main Toolbar |
| Map | showLogOut | Show Log Out | Allows user to be able to view button for Log Out on the Main Toolbar |
| Map | spatialFun | Spatial Functions | Allows user to be able to view button for Spatial Functions on the Advanced Toolbar |
| Map | spatialSum | Spatial Summary | Allows user to be able to view button for Spatial Summary on the Advanced Toolbar |
| PlotAppInGrp | pagrp1 etc. | [User Defined Label] | Anything in the Plot App Group category has been created by the customer's admin user. It will allow access to the specified Plot Application group (Group of Templates) |
| PlotAppIns | pa1 etc. | [User Defined Label] | Anything in the Plot App category has been created by the customer's admin user. It will allow access to the specified Plot Application Template |
| Redline | redlineDeleteAll | Delete all Redline Objects | This is a function that allows the user to delete all Redline objects within a layer |
| Search | s1 etc. | [User Defined Label] | Anything in the Search category has been created by the customer's admin user. It will allow access to the specified Search |
| Trim | Trim1 etc. | Trim Records | Allows the user to integrate to "trim records" via the Advanced Toolbar integrations icon. |