enlighten Toolbar Icons


Context Menu Tools


Login Information
Once you have typed in your enlighten URL you will be taken to a login page where you will need to enter a username and password. The username and password will be given to you by your enlighten administrator.
You can either login normally by entering username and password, alternatively using the LDAP option. Both scenarios are indicated below
- You will receive a unique username and password.
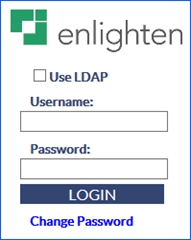
Fig: Unique Sign on Details - Your username and password will match your windows authentication login details. To use this option you will have to tick a checkbox – Use LDAP and enter your windows credentials.
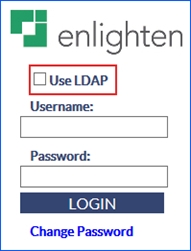
Fig: Enter Windows credentials - If you choose to select the Use LDAP option, the username and password (based on your windows credentials) will automatically get populated
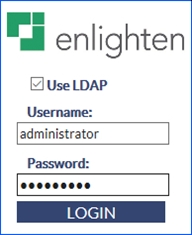
Fig: Single Sign-On, Windows Credentials Automatically Populated - If you enter an incorrect password three times you will be presented with a validation code for verification. If entered successfully you will be directed to the landing page of the map on enlighten.
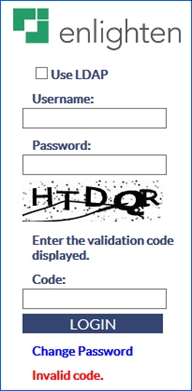
Fig: Validation Code
Layer Control and Legend
The Layer Control bar is the pane located down the left-hand side of the screen. This shows the list of groups and layers available. It also acts as a legend by showing how each feature is displayed graphically on the map.
What is a Layer?
A layer is usually a group of objects that belong to a specific thematic category and is of the same geometric type. For example, all sewer pipes are stored in one layer but are on a different layer to water pipes or to sewer nodes.
It is possible, however, to sort layers into groups in order to display objects together that have different geometric types but share a common theme: for example, water pipes, water nodes, and water valves belong to the layer group Water.
Vector layers are classified into different geometric type, these being text, point, line or polygon. However, if text displayed on the map is not selectable, it is probably not a text layer but a text label of a point, polygon or line.
Layer Ordering
Once the layers have been organized into groups such as Sewer or Water, all the related data-sets will be listed under the group header.
When required, the enlighten Administrator can add new layers and layer groups as well as changing the layer ordering within or between groups.
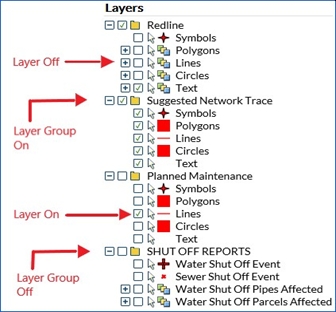
Fig: Layer Control Bar
Scale Dependency
Map layers can be set to become visible only at a certain map scale. In other words, the more you zoom in, the more details are displayed. For example, suburb boundaries may be visible at a scale of 1:60,000, land parcel outlines at a scale of 1:30,000 and roads at 1:6,000.
By setting scale dependencies on each layer, map loading speed is improved, and a more effective display of map features is provided. Your enlighten Administrator can set the scale dependencies as required.
Turning Layers and Layer Groups On/Off
A layer or layer group is turned on when the box next to its name is checked. Those layers that are listed but are not displayed in the map can be turned on by ticking the box next to them.
When a layer is turned on it will expand to show its legend symbol.
Common Tools
 Search Menu
When the search icon ![]() is selected, the Search pane will load on the right-hand side of the screen in the side pane. The searches available in the drop-down list are configured by your enlighten administrator. When the user clicks on the Search function, the first search in the first Search Group is displayed by default. If the administrator makes changes to the search group order, the order of Searches will change accordingly.
is selected, the Search pane will load on the right-hand side of the screen in the side pane. The searches available in the drop-down list are configured by your enlighten administrator. When the user clicks on the Search function, the first search in the first Search Group is displayed by default. If the administrator makes changes to the search group order, the order of Searches will change accordingly.
The search example below is a Water Pipes search. To perform a search showing Water Pipes, you would do the following:
- Select the search Water Pipes from the list of searches available in the drop-down list.
- Enter the additional search criteria, in this case all Pipes with a Diameter equal to 700 will be searched.
- Select the Search button.
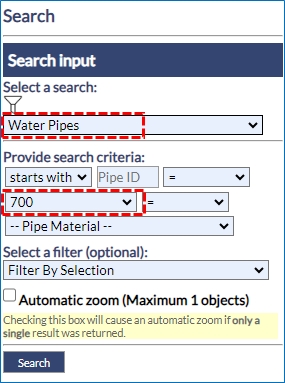
Fig: Search Menu Side Pane - The resultant search displays a list of Water Pipes, which match the search criteria, in the Search Results dialog box. In this example a total of 19 Water Pipes match the search criteria.
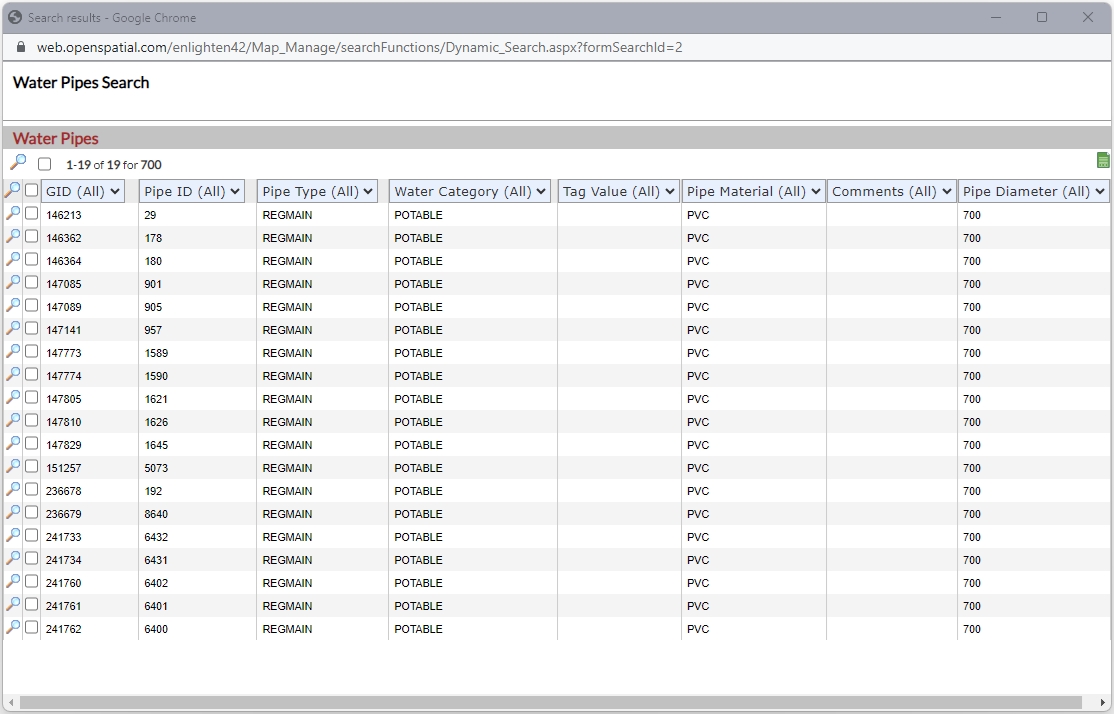
Fig: Search Results Dialog Box for Water Pipes with 700 Pipe Diameter - If a selection set has already been saved, this can be added to the search criteria from the Select a filter drop-down menu and the chosen selection set used to further filter the search results. See selections.
In the example below, the filter Randpark Water has been added to the search criteria, and in the Search Results dialog box, the number of pipes returned has reduced to 5 pipes.
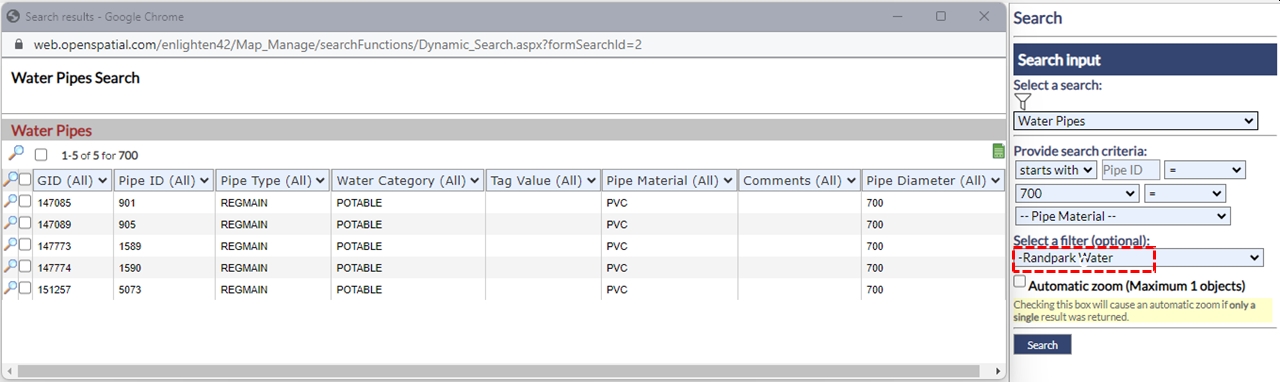
Fig: Search Results Dialog Box applying a saved selection set as an additional search criteria filter - Once a search is completed where more than one record is found, the search results dialog box will open displaying the search criteria as information. In this case, we can view all the parcels within the town Alexandra with access to water.
- When the top magnifying glass is selected, you will zoom to the extent of all items shown in the search results.
- The second magnifying glass on the grey bar will zoom to all items that have the box ticked next to them in the list.
- The magnifying glasses in the list view will take you to the single object on the map represented in the adjacent record.
Fig: Zoom options in Search Results - Zoom to all results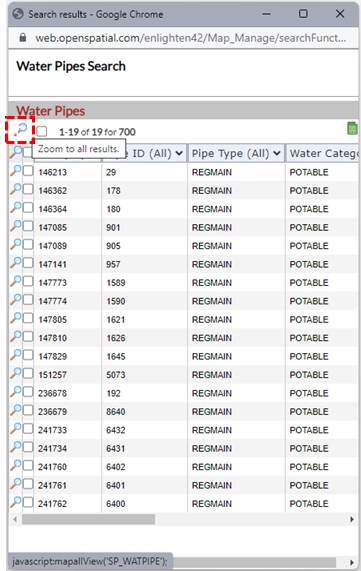
Fig: Zoom options in Search Results - Zoom to checked object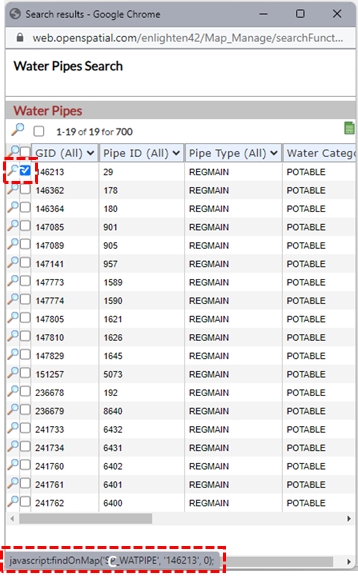
- The Search Results can be filtered using the column header drop-down boxes.
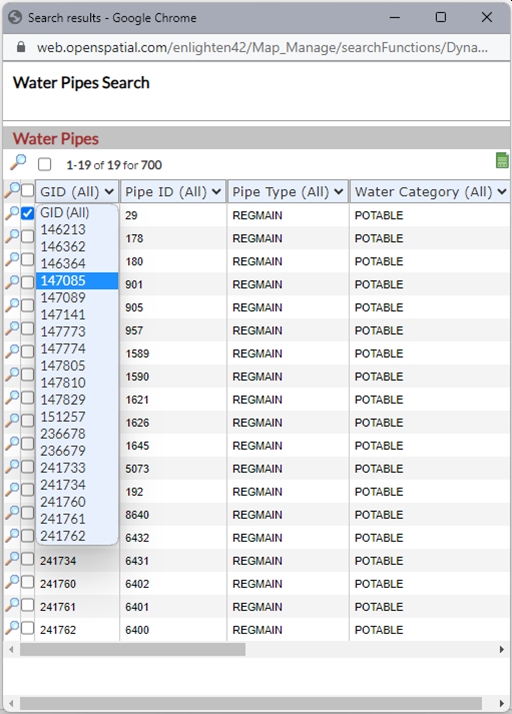
Fig: Filter Search Results on values below Column Headers - The Search Results dialog box can also be used to invoke advanced forms simply select one or more objects from the table and click the advanced forms button
 in the top right-hand corner of the dialog box.
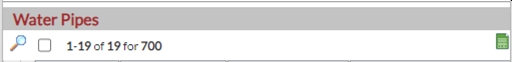
Fig: Invoke Advanced Forms from the search results list - The search can also be limited to the selection currently active in the map by selecting Current Map Selection in the Filter By Selection drop-down menu.
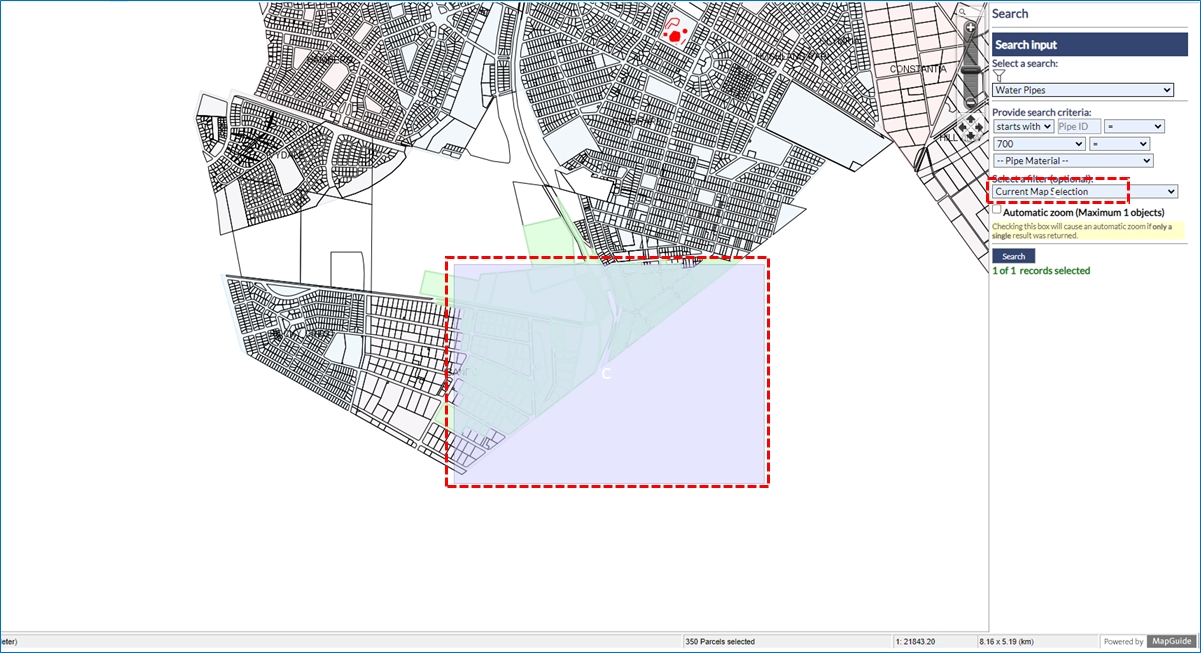
Fig: Search using Current Map Selection
Point Object Searches
If the tick-box for Automatic Zoom is checked, and a single result was returned in the search, the map will zoom to that object on the map. For Point Objects, the zoom buffer setting POINT_ZOOM_BUFFER can be increased or decreased by the enlighten Administrator, or by a user with admin privileges.
- The Automatic zoom feature (when ticked) takes the user directly to the result, provided a single result was returned from the search. If the Automatic zoom tick-box is not checked, the user is taken to the Search Results dialog box where they can select the record to zoom to from the resultant list.
- In the example below, a search was completed for a single Water Node (GID = 143725) and the POINT_ZOOM_BUFFER was set to 20m. The Automatic Zoom tick-box was checked, and the map was zoomed so that the resultant node .
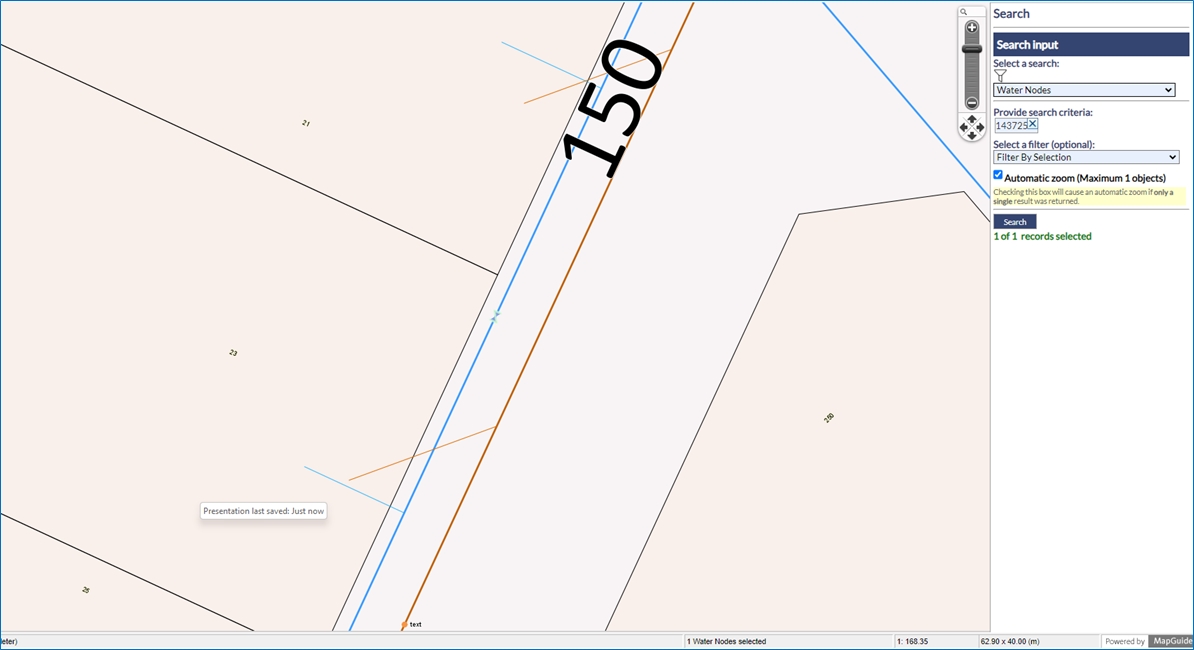
Fig: Point Search Buffer with buffer distance of 20m - In the second example below, the same search was completed for the same Water Node, however the POINT_ZOOM_BUFFER was set to 60m.
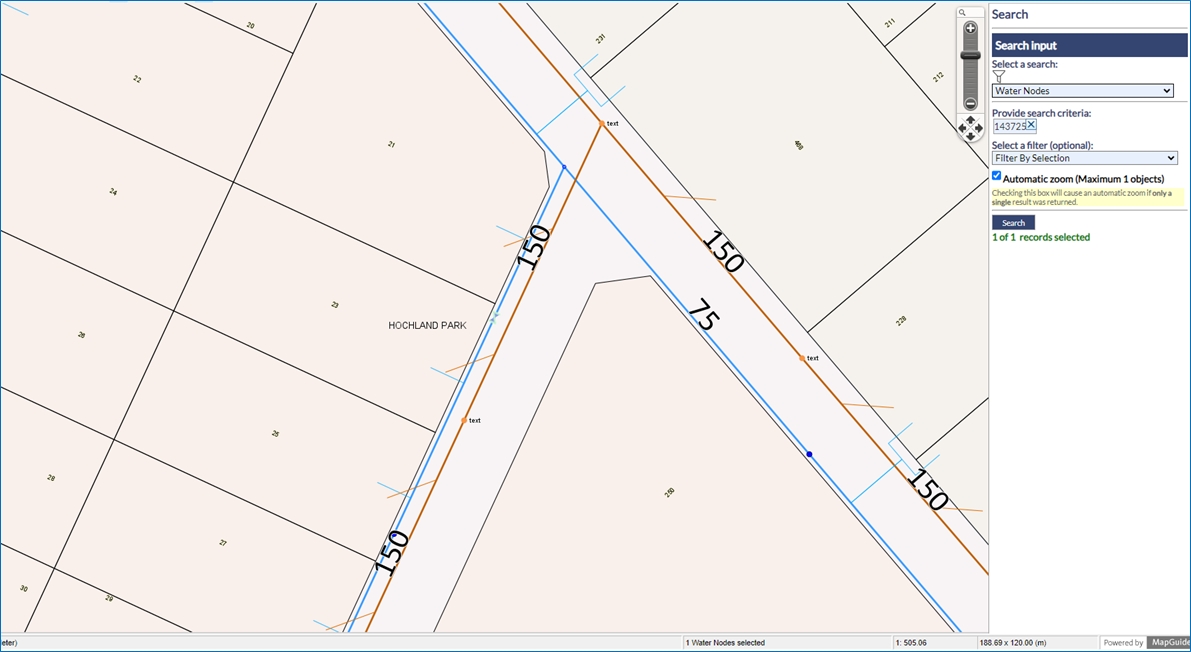
Fig: Point Search Buffer with buffer distance of 60m
Assigning Searches to Users
enlighten provides the option of assigning customized search types to specific users. This is because, in most instances, not all departments want or have the need to access the entire list of search types. Please contact your enlighten Administrator if a specific search is required.
Dynamic Filtering on Searches
When a user initiates the Search function, there will be a new feature available, called a Dynamic Filter. The aim of this tool was to create an ease of convenience experience for the user, as in some organizations there could be multiple searches configured. This would make it difficult scrolling down the list, through each search and selecting the relevant one, hence the need for the Dynamic Filter. This then allows the user to easily filter for the search titles of relevance, saving time and effort.
To activate the Dynamic Filter option:
- Click on the Filter icon, next to the Select a search drop-down menu.
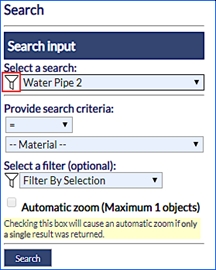
Fig: Dynamic Filter - A new text box input item will become available upon clicking the Dynamic Filter icon. This enables the user to easily type in a keyword of a search title, and the system will automatically filter all searches containing the specified keyword.
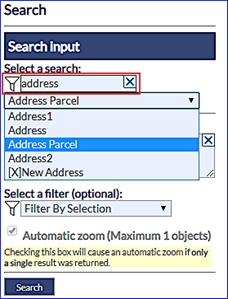
Fig: Dynamic Search Filter Results - If the user then clicks on the drop-down menu of the select a search item, then the user can easily see that only searches containing the keyword address have been filtered out in the select a search drop-down.
- After selecting the relevant search the user can once again click on the Dynamic Filter icon, which would then change to black in colour. This change in colour (or a fill) indicates to the user that the Dynamic Filter is now active.
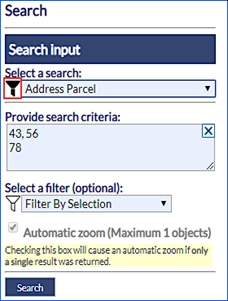
Fig: Dynamic Filter Active - Hence this Dynamic Filter tool helps the user to filter through the necessary searches, thereafter to type in a keyword for a list of searches. Once done apply the dynamic filter condition and then navigate between a short-listed set of searches, which the dynamic filter retains. This saves time and allows for a more user-friendly experience.
Common Key Searches
A Common Key Search allows a search to find results across multiple components . A Component is an additional set of spatial and attribute data that can be added to a search. When a component is added to a search that shares the same key (column) a common key search can be created. For example, Sewer and Water Service Connections (SP_WATSERV and SP_SEWSERV) can be linked to Land Parcels (SP_PARCEL), where PRCL_GID in the service connections tables match the Parcel GID value.
A common key search will query information from the search and search components. Allowing users to enter for example GID values that may belong to several tables and return results.When a common key search has been configured in the administrator's environment, the user can enter comma separated lists in the search field in the user environment.
- The example below shows a Common Key Search on Parcels linked to Water and Sewer Service Connections.
- The user enters a string of GID values into the Search Criteria separated by a comma, i.e. 47817,160104,84950,11921,84952,160103,24403,47814. There must not be any spaces between the values and the comma separators.
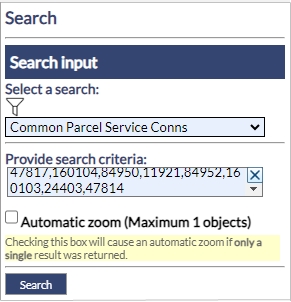
Fig: Common Key Search Criteria - The results of the search detail in which component (Spatial or Attribute Table) the entered GID values were found. The results also display Warnings for where entered GID values were not found in any of the components.
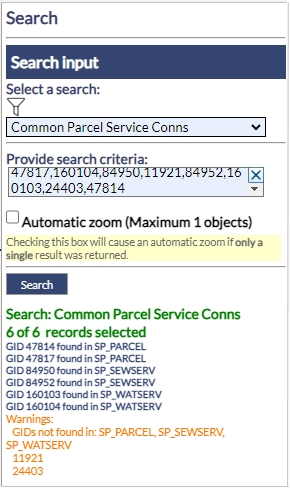
Fig: Common Key Search Results - When multiple records are matched, the Properties Pane displays the the attributes of the matched spatial objects. In the example below, the user can select the Spatial Table from the drop down list as well as the matched record, and then use the Zoom to this Feature button
 to zoom to the selected object on the map.
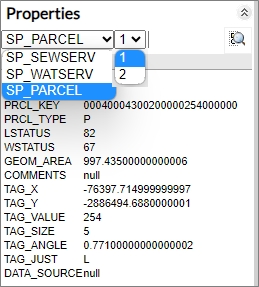
Fig: Properties Pane displaying results of matched records from Common Key Search
Search with spaces are converted into Commas
In the search criteria where there are spaces, this will be treated as a comma and the search output will display it in the appropriate manner. This means that the user can search for specific results containing values which are specified in the search criteria.
- The example below is setup based on Address Parcel, essentially searching on the street numbers, which are either 1 2,32,50 and 65.
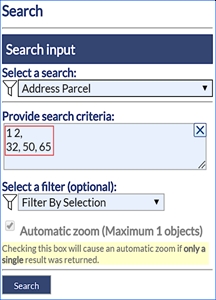
Fig: Spaces in Search Criteria - Once this is searched, the user can click on the Search button and the following output will be generated:
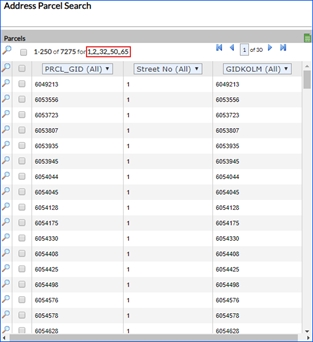
Fig: Spaces in Search Criteria converted into Commas
Clear input fields
When users access enlighten from within a mobile device, then it becomes difficult to input and clear the input on text fields. As a solution to this, a distinct X button was added to allow the user to clear input by pushing one button, as opposed to hitting backspace multiple times.
This feature also makes it easier for the desktop user to quickly remove information from the input field, saving time and increasing efficiency.
- The example below references Searches, and the X button is available for the user to clear the search criteria field for the search called Address Parcel.
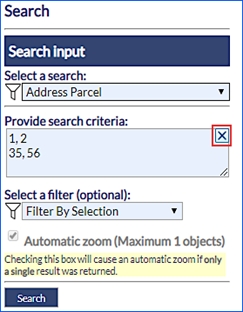
Fig: Clear selection in Searches
Search pane displays number of records selected
When the user activates a search, if there is only one record and if the automatic zoom checkbox is selected, then enlighten will automatically zoom to the searched record.
However, if the user activates a search which yields multiple records, then the search results dialog will pop up with a list of matches according to the search criteria. If the user selects multiple records from the search results dialog, then the number of records being searched will also be displayed on the task pane.
An example of the Search User Interface can be seen below:
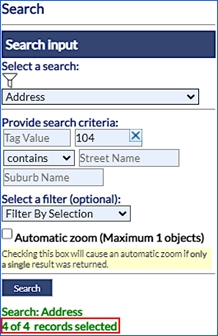
Fig: Number of Search Records selected
 Redline
When the Redline icon ![]() is selected the Redline Menu will load in the right-hand side pane of the web page. The Redline Menu allows adding, editing and deleting redline objects from the redline layer. Please make sure your pop-blocker is disabled when using the Redline functionalities.
is selected the Redline Menu will load in the right-hand side pane of the web page. The Redline Menu allows adding, editing and deleting redline objects from the redline layer. Please make sure your pop-blocker is disabled when using the Redline functionalities.
When redline objects are created, they are saved in the enlighten database, within the following tables: SP_REDLINE_POLYGON, SP_REDLINE_CIRCLE, SP_REDLINE_LINE, and SP_REDLINE_TEXT.
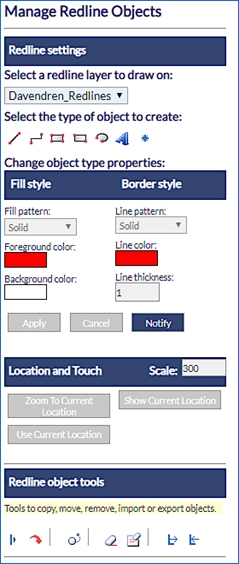
Fig: The Redline Menu
To create a redline object follow the steps outlined below:
- From the drop-down box, select a layer where the new object is going to be stored.
- Select the object type: Line, Polyline, Polygon, Rectangle, Circle, Text or Symbol. The formatting options will change depending on the object type selected.
- For Line and Polyline objects, you can customize the line pattern, colour, thickness (1 smallest, 300 largest) and arrow size. Users can also specify the unit of measurement which the segment being drawn, is displayed in (Line length setting). This will only be populated for the Polyline feature as a single line is essentially just one segment.
A Fix length checkbox is also available where the user can set a fixed length for a given segment to be drawn in, to maintain consistency. When clicked the the segments of each object can the be defined individually or the user can maintain that length until the object is completed.
A tooltip is displayed showing the Total distance (entire object) and Current distance (current segment). Tooltips are only displayed for Polyline and Polygon objects, and will not be displayed for Rectangle or Circle objects.
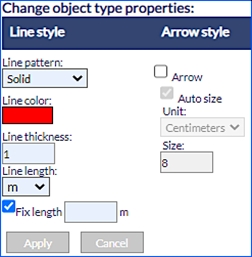
Fig: Redline Line Style Options - As objects are being drawn on the map, the current zoom distance and attempted length is calculated (in relation to the scale). If the specified fixed length, exceeds the current visible extent of the map, then a red border will outline the fix length dialog box and the following message will be displayed: “The length exceeds the limit of the current visible extent of the map”. Thereafter the display will be ignored.
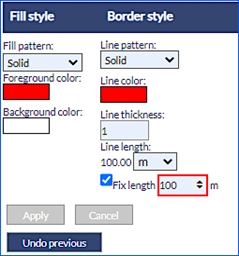
Fig: Fix Length notification - For Rectangle, Polygon, and Circle object types, select the fill style and border style from the menu. Users can also specify the unit of measurement which the segment being drawn, is displayed in (Line length setting) and is disabled for the Rectangle feature. A Fix length checkbox is also available where the user can set a fixed length for a given feature to be drawn in, to maintain consistency.
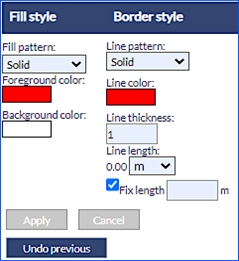
Fig: Redline Polygon Style Options - For Text, objects select the font and the font size and enter the text in the text input box.
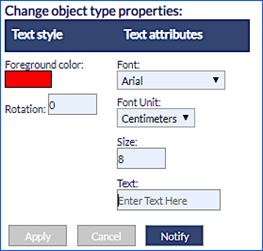
Fig: Redline Text Style Options - For Symbol, objects select the symbol style and symbol attributes.
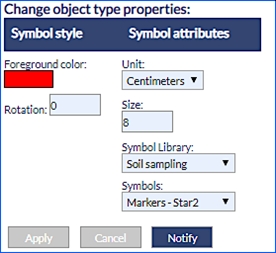
Fig: Redline Symbol Style Options - Place the object on the map using one of the tools described below:
If an invalid colour has been selected to draw redline objects, or prehistoric invalid entries are found within the database, then the system will revert any invalid colour codes to the default redline colour which is Red. This is a safety feature within enlighten and prevents any corruption of redline data based on non-existent colour codes.-
 Line Tool
This tool allows the user to draw a simple line on the map. After selecting the Line tool button, click and drag on the map, navigate to the end point and let go of the mouse button to record the end point. A line will be created between these two points and stored in the redline layer. An arrow-head will be drawn at the endpoint of the line if the Arrow check-box is selected.
-
 Polyline Tool
This tool allows the user to draw polylines on the map. After selecting the Polyline tool button, click on the map to place the start point. Each additional click will add a new segment to the polyline. Hold down CTRL and click on the map to finish drawing the polyline, this will be created and stored in the redline layer. An arrow-head will be drawn at the endpoint of the line if the Arrow check-box is selected.
 Polygon Tool
This tool allows the user to draw polygons on the map. After selecting the Polygon tool button, click a point on the map to start drawing the polygon. Each additional click will add a side to the polygon. Hold down CTRL and click on the last vertex to finish drawing, the polygon will be closed automatically.
 Rectangle Tool
This tool allows the user to draw rectangles on the map. After selecting the Rectangle tool button, click and hold down the mouse button where one corner of the rectangle should be located. Drag the mouse outwards to extend the rectangle. Release the mouse button at the required point and the rectangle will be created and stored in the redline layer.
 Circle Tool
This tool allows the user to draw circles on the map. After selecting the Circle tool button, click and hold down the mouse button where the centre of the circle should be located. Drag the mouse outwards to increase the radius of the circle. Release the mouse button at the required radius and the circle will be created and stored in the redline layer.
 Text Tool
This tool allows the insertion of Text on the map. After selecting the rotation, size, style, and colour type in the text to be displayed and click on the map to place it. The size together with the type of unit can should be defined by the user.
 Symbol Tool
This tool allows the insertion of a symbol on the map. After selecting the rotation, size and type of symbol click on the map to place it. When using this function for the first time, please clear the browser cache by selecting (when using Internet Explorer > Tools, Internet Options, Delete all offline Contents).
Users would now be able to define the line colour and line thickness whilst having the relevant tool active hence this changes the redline feature on the fly. This customization would be useful in situations when aerial imagery is active and the redline features are not distinctly visible to the user.
Note: The redline priority draw order would be Text, Symbol, Line, Circle and lastly Polygon. This means that the user would be able to edit/select overlapping redline features and would not be limited to the last drawn/polygon redline feature only.
-
- To add a notification to the new Redline object select the Notify button.
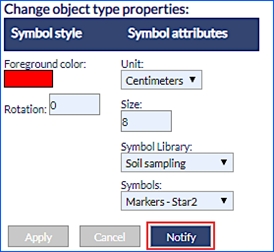
Fig: New Redline notificationsNote: The Notify button will only be visible when redline layer notification is enabled. Information on how to enable redline notifications can be found in the enlighten Administrators guide. - Define the notification by adding a Description, selecting a Type and Status.
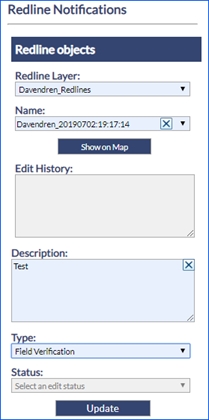
Fig: Redline Notifications dialog box - 9. Click the UPDATE button to submit the notification.
A default Redline Notification Name is added in the following format user_YYYYmmdd:HH:mm.ss, for example: admin_20190405:18:48.47
Editing Redline Objects
Extra redline tools are available from the Redline Object Tools section of the redline side pane. The tools available are:
- Annotate line lengths
- Copy to redline
- Move object
- Delete selected redline objects
- Delete all redline objects from layer
- Export Redline Layer
- Import Redline Layer
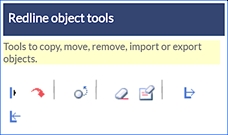
Fig: Editing Redline Objects
To use the Redline Object Tools follow the instructions below:
- Select the Redline Tool from the enlighten toolbar.
- In the side pane that opens, select the layer you wish to work on.
- Follow the instructions below regarding the Redline Object Tool that you want to use.
-
 Annotate Line Lengths
This tool allows the user to annotate existing line and polyline objects with their lengths. First select the lines that need to be annotated, then click on the annotate line lengths button.
Annotated line lengths will be saved to a temporary map layer called Annotations, however if the user wishes to have this saved permanently to the Redline Text layer then the Save checkbox must be ticked on.
Note: Selected objects do not have to be on the same layer and that the tool will work for both redline and non-redline objects. -
 Delete Annotated Line Lengths
This tool allows the user to delete existing annotated line and polyline lengths. First select the annotated text that need to be deleted, then click on the Delete Annotated line lengths button.
-
 Edit Annotated Line Lengths
This tool allows the user to edit existing annotated line and polyline objects lengths. First select the annotated lines that need to be edited, then click on the Edit Annotated line lengths button. The units can be altered here to allow the user to display the unit of preference.
-
 Copy to Redline
Copy to Redline allows one or more selected map objects to be copied to a nominated redline layer. The objects selected do not have to be on the same layer, and the selection set can be a combination of point, line, circle and polygon objects. If a selected object is a multi-line or a multi-polygon object, two separate objects, with different GID values, will be copied to the corresponding Redline spatial table, i.e., SP_REDLINE_LINE or SP_REDLINE_POLYGON.
- Select the objects on the map.
- Select the desired redline layer from the drop-down list in the side pane.
- Select the Copy to Redline Tool.
- All selected objects will be copied to the nominated Redline layer.
The selected features will be copied to the nominated redline layer
Note: Any object attributes that cannot be extracted will default to the relevant current setting on the redline menu -
 Move Object
This tool allows the user to move redline objects to another location within the map in the same redline layer. First select the object that needs to be moved, activate the Move Object tool and then click on the map where the object will be moved to. Only one object can be moved a time.
-
 Delete Selected Redline Objects
This tool allows the user to delete selected redline objects from the map. First, select the object(s) that needs to be removed from the map and then click the Remove Object tool button to delete them.
Note: Multiple selected objects must reside on the same redline layer. -
 Delete All Redline Objects from Layer
This tool allows the user to delete all the objects in the selected redline layer from the map. First, choose the redline layer to delete from the layer drop-down box and then click on the Remove All Objects tool button. A warning message will appear asking to proceed or to cancel the operation.
Note: If the Delete All Redline Objects is not ticked within the User Admin > Manage User & Permissions > Functions tab, then that function is removed here and will not be visible. -
 Export All Redline Objects from Layer
This tool allows the user to export all the objects in the selected redline layer to a file or to the database and to share them with other enlighten users. First, choose the redline layer to be exported from the layer drop-down box, and then click on the Export All Redline Objects from Layer tool button. The Export screen will appear. There are several options for exporting redline objects:
- To export to a file, select Export layer to a file on your device. Thereafter the user should enter the Source Layer to be exported. Lastly, the user should specify an Export Name. This file will be saved as an XML.
- To export to the database, select option Export layer to Oracle database. Thereafter the user should enter the Source Layer to be exported. Lastly, the user should specify an Export Name. This will save the redline layer to the SP_REDLINE_EXPORT table.
-
 Import Redline Objects to Layer
This tool allows the user to import a previously exported redline layer (from a file or from database export) into either a nominated redline layer or into a new layer. After clicking on the Import Redline Objects to Layer tool button, the Import screen will appear. There are several options for importing redline objects:
- The user can import a redline layer from a file on the device. The user will need to specify a Destination Layer from the drop-down list. This would then make the Choose File option available, and once selected will take the user to the Browse Screen. Once the redline .xml file has been selected the user can click on Submit and this will Import the redline layer into the Destination layer which was specified.
- The user can also import a redline layer from an Oracle database. Here the user will be prompted to enter in the Database source and then the Destination Layer to which the redline layer will be imported. Once done the user can click on the Import button to complete this function.
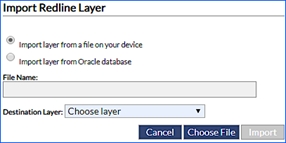
Fig: Import Redline layer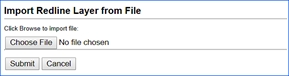
Fig: Import Redline layer from a fileNote:When the user captures and a redline object, and hovers the mouse pointer over, then a tooltip will be displayed.
-
 Redline Notifications
When the Redline Notifications icon is selected ![]() it allows the user to add a Description, Type and Status to the relevant redline object selected. Each change which occurs in the Redline Notifications Pane will be recorded within the Edit History window.
it allows the user to add a Description, Type and Status to the relevant redline object selected. Each change which occurs in the Redline Notifications Pane will be recorded within the Edit History window.
Redline Notifications allows users the opportunity to place notifications on redline layers. The users now have the option to place a notification on designated users or groups, for any changes made on a specific redline layer. The notification allows user groups/users to be informed of any changes which are made to that specific redline layer. However, for this to be possible, the redline layer must be assigned to the user who wishes to receive the notifications.
If the Redline Notifications icon displays a red exclamation symbol  in the top left corner
 ![]() , this indicates to the user that changes have been made on a Redline layer on which they have been configured to receive Redline Notifications.
, this indicates to the user that changes have been made on a Redline layer on which they have been configured to receive Redline Notifications.
To Edit a Redline object the user would need to follow the steps listed below:
- Click on the desired redline object, to select it for Editing. When the user selects the redline layer for editing, the following fields would be auto-populated:
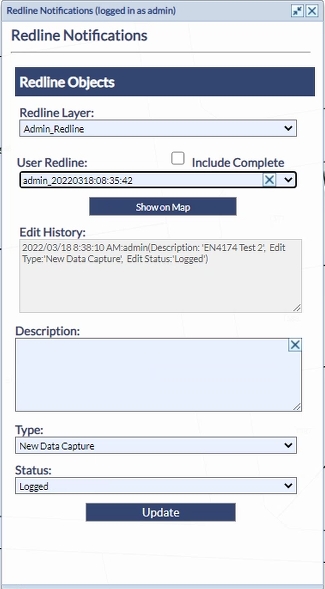
Fig: Redline Edits- Redline Layer: This is derived from the layer in which the redline object is created within.
- User Redline: This is a value that gets automatically populated by a database sequence.
- Include Complete (check box): Redline markups whose Status is set to Complete will not be displayed as a redline object in the User Redline list unless the Include Complete check box is ticked.
- Show on Map: If the user has selected a redline segment from the User Redline list, selecting the Show on Map option zoom to the selected object extents on the map.
- Edit History: This window records the changes made on a specific redline object.
Note: There is a known issue with the display of the Redline Notifications dialog box on Chrome, Edge, Internet Explorer and Firefox. Please consult the Known Issues section at the end of this documentation. - Next the user would be prompted to enter in an appropriate Description of the redline object. The user should enter a meaningful description as to the reason for the edit, for example: Verified object.
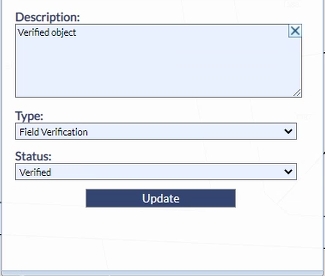
Fig: Redline Notification Edit Description - The user can then select the Type from the drop-down list. There are two options:
- Field Verification: This is data which has been verified on-site by staff and is to be captured.
- New Data Capture: This refers to new data which is being captured.
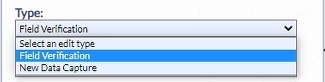
Fig: Redline Type - Click on the drop-down arrow in the Status section and there would be a choice of five options:
- Change Applied: This indicates that the changes have been applied.
- Change Rejected: This indicates that the changes have been rejected.
- Complete: This indicates that the changes are completed and no further updates are required on the Redline object.
- Logged: This indicates that the redline objects have been logged onto the system.
- Verified: This indicates that the redline objects have been verified.
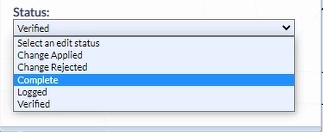
Fig: Redline Status - Once completed the user can then click on the Update button, to save the changes. The wording Updating redline edit…… is displayed while the update is in progress. Once the update is completed, the wording Done.
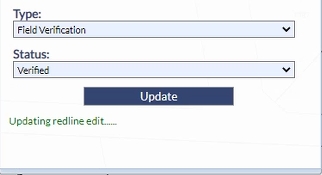
Fig: Redline edit update in progress - The Edit History reflects the edits made.
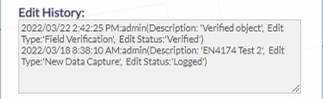
Fig: Redline Edit History - Once the Redline Object does not require any further verification or edits, the user should do a final update to change the redline Status to Complete. Once this update has been applied, the tick box for the Include Complete must be checked
 to permit completed redline objects to be displayed in the User Redline list.
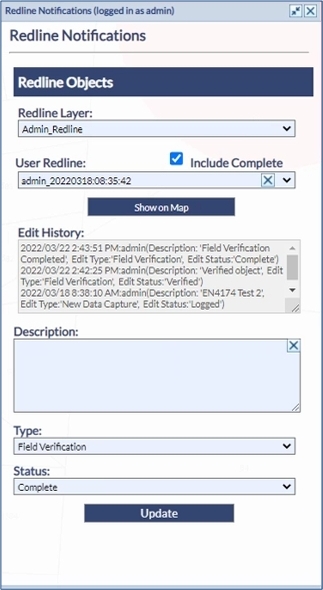
Fig: Redline Notification Include Complete check-boxNote: Based on the new Map configuration setting, Completed redline objects will not be displayed on the redline layer on the map if the Redline Complete filter has been applied by the administrator. If the user selects a redline object whose status is set to Complete, and attempts to use the Show on Map function to zoom to the completed redline object, the following message will be displayed. 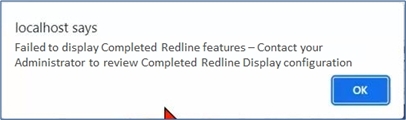
Fig: Completed Redline objects failure to display message - The user should contact their enlighten Administrator to check the Redline Display configuration. Further information on how to setup Notifications can be found in the enlighten Administrators guide, in the Map Admin section of Redline Layers, under the Notification Alerts sub-heading.
Redline Notifications on Advanced Forms
When selecting a Redline object/s on the map and selecting the Advanced Forms icon ![]() , users can view general information about the Redline object/s, information about Redline Notifications for the selected object/s, as well as historical information on all Redline Edits for the selected object/s.
, users can view general information about the Redline object/s, information about Redline Notifications for the selected object/s, as well as historical information on all Redline Edits for the selected object/s.
Refer to the Advanced Forms section for information on the Tree View, List View and Detail view in the Advanced Form, how to export inforamtion, and how to view and manage large amounts of information.
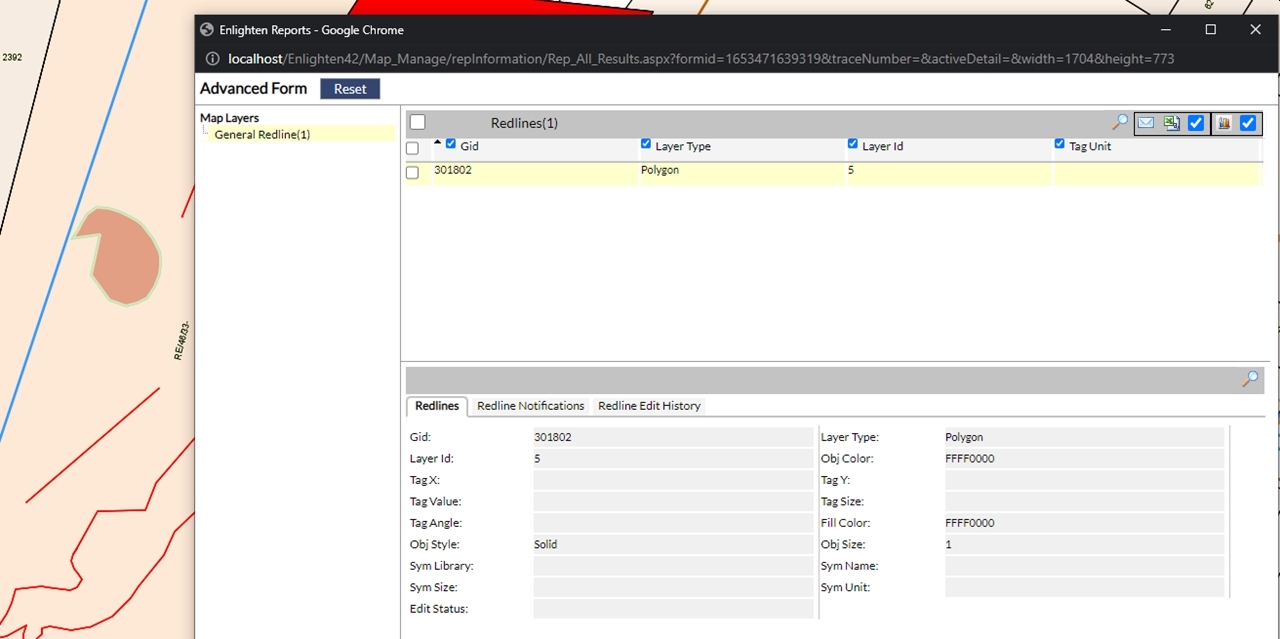
Fig: Advanced Forms Redlines tab
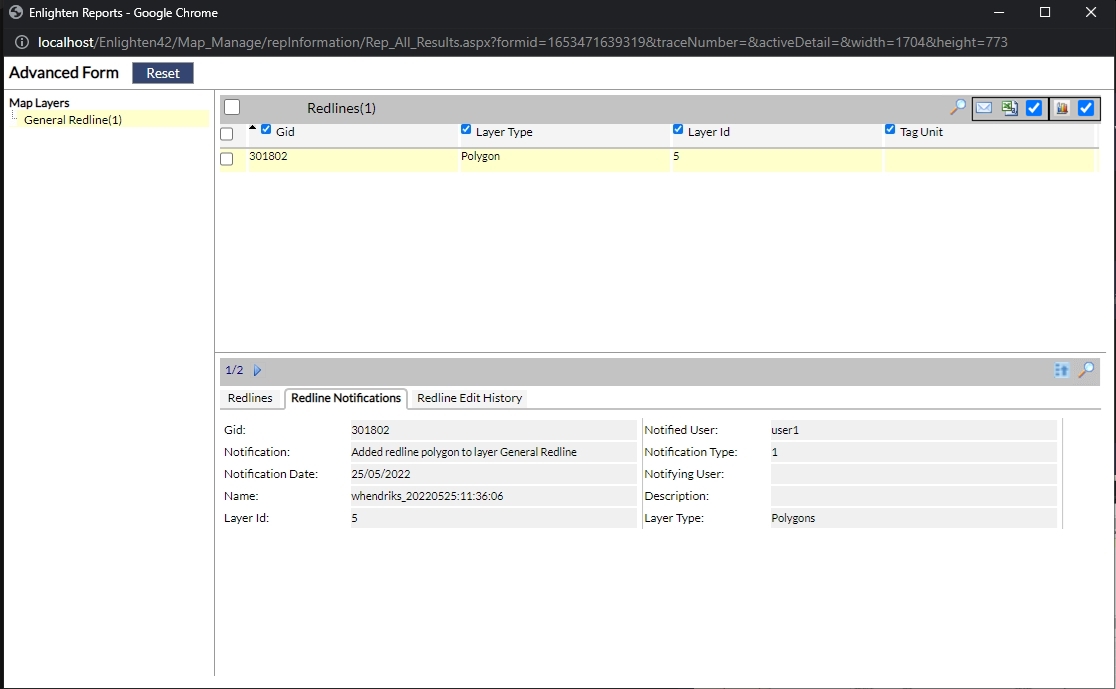
Fig: Advanced Forms Redline Notifications tab
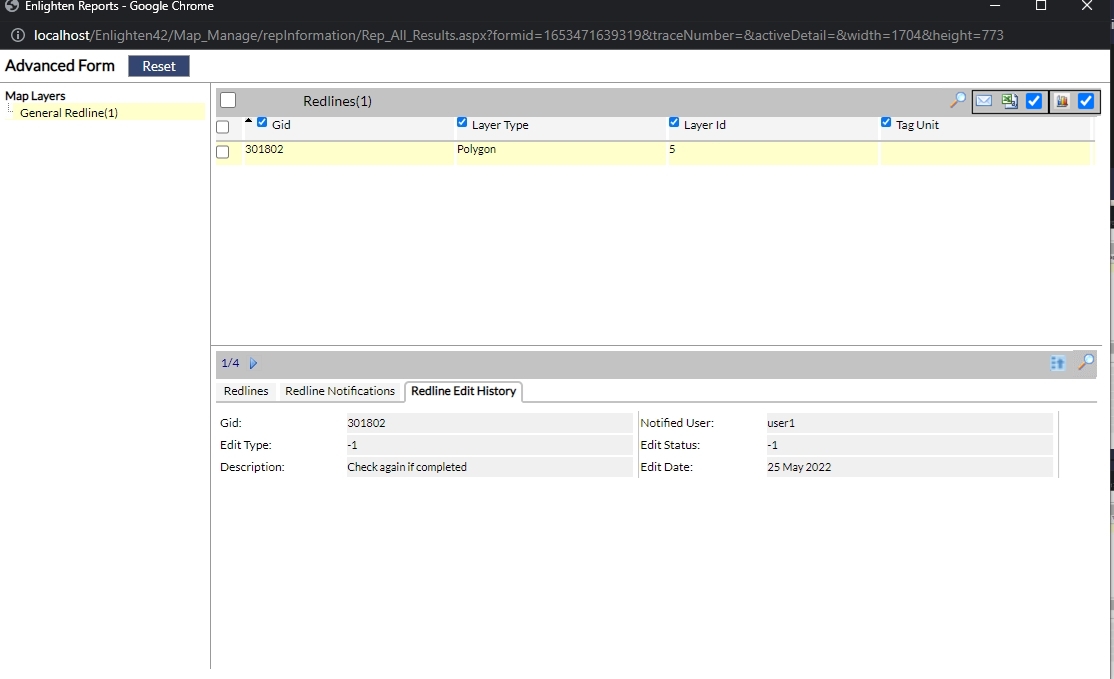
Fig: Advanced Forms Redline Edit History tab
Clear input fields on Mobile Device
When users access enlighten from within a mobile device, then it becomes difficult to input and clear the input on text fields. As a solution to this, a distinct X button was added to allow the user to clear input by pushing one button, as opposed to hitting backspace multiple times.
This feature also makes it easier for the desktop user to quickly remove information from the input field, saving time and increasing efficiency.
The example below references Redline Notifications, and the X button is available for the user to clear the Name field and Description for the redline layer called Verified_Redlines and redline object Davendren_20190630:22:25:14.
![]()
Fig: Clear selection for Redline Objects
 enPlot
The new plotting engine and plot application deliver:
- High-quality plotting.
- Printing to scale.
- Printing on A0 through to A4 paper
- Generates PDF output from within enlighten and third-party applications
Functions are configured by your enlighten administrator. Not all functions below may be available to you.
- To access enPlot select the enPlot tool
 from the enlighten toolbar. This will open a side pane that will display all the plots that have been configured. Groups will be displayed with the option to expand them. Underneath the groups, all the plots that have been defined for you will be visible.
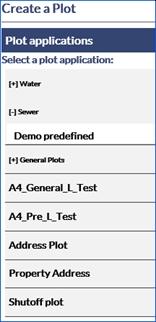
Fig: enPlot Side Pane - Once you select a plot application from the list an enPlot dialog box will appear. Plot options are dependent on configuration. Plots may be:
- Pre-defined Plot: A Pre-Defined plot contains more information, which is pulled from the database.
- General Plot: A General plot is usually a simple interface.
Note: There is a known issue with plotting of redline objects on Pre-Defined plots.
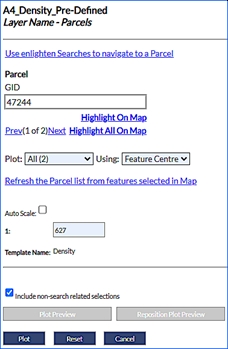
Fig: Pre-Defined Plot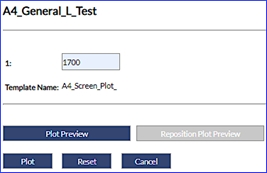
Fig: General Plot - The functionalities that can be configured vary between General and Pre-Defined plots. All available options are included below:
- Auto Scale: Auto scale uses a value that is pre-defined by your administrator when selected.

Fig: Auto Scale in Plot Application - Scale: The scale is initially taken from the map and displayed in the text field. This field can be configured by entering free text.
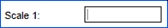
Fig: Scale in Plot Application - Page Orientation: The page orientation can be toggled between landscape and portrait in the drop-down list.
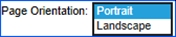
Fig: Page Orientation Plot Application - Template name: More than one template can be assigned to a plot. If this is the case you will be given a drop-down list containing plot templates. If this has not been set, you will be able to see the single template the plot is based on.
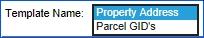
Fig: Template Name Plot Application - Use enlighten searches to navigate to a ‘configured search’: If a search has been configured for a plot you will have this option available. This link will open the ‘Search’ side pane, where you can locate and zoom to specific features. Once your feature is selected on the map you can refresh the plot information by selecting Refresh the configured Search list from features selected in the map.
Fig: Use enlighten Searches to Navigate to a 'Configured Search' Plot Application - Refresh the ‘configured search’ list from features selected in the map: If the configured search is refreshed based on features selected on the map, the configured search dialog box list will be updated.

Fig: Refresh Features Selected on the Map Plot Application - Search Results: The search results displayed are dependent on the search configured for the plot and will vary. When a feature is selected on the map the results will automatically populate the fields defined.
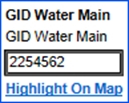
Fig: Results for Selected FeatureNote: When no items are selected on the map you will see the following message.

Fig: Message Received when no Objects are Selected in Plot Application - Highlight on Map: Highlight on the map will select and zoom to the single feature whose details are shown in the search field.
- Highlight All on Map: Highlight all on the map will select and zoom to all features selected in the plot preview.
- Plot:
- Current: Will provide a single plot PDF.
- All: Will provide a plot PDF for each unit selected on the map.
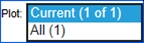
Fig: Plot Options Plot Application
- Using:
- Map Centre: All that is selected on the map will be highlighted in the plot or plots.
- Feature Centre: Only the feature whose information is shown in the search boxes will be displayed in the plot. When you plot all with feature centre each plot shows a different feature. When Feature centre is chosen plot preview is disabled.
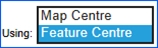
Fig: Using Options Plot Application
- Batch Plot: When a combination is used setting plot to All and using to Feature Centre as below you can do batch plotting.
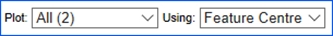
Fig: Settings for Batch Plot- A batch plot will create a number of plots specified by the number of features selected and create a separate plot PDF highlighting each separate feature.
- Include non-search related selections: When ticked this function includes non-search related selections to the generated plot. This is exclusive to pre-defined plots and unavailable for use within general plots.
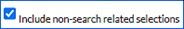
Fig: Non-search related selection option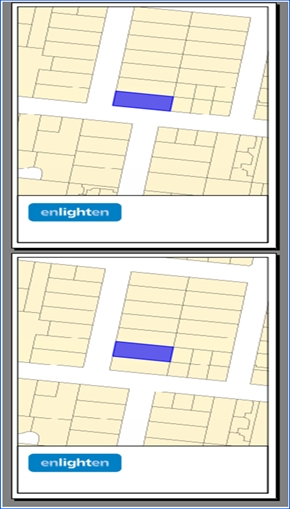
Fig: Batch Plot for Parcels SelectedNote: The user now has the ability to change/customize the selection colour on the plot engine results, which offers a more user-friendly output. This can be customized in the “Manage User Options” pane and change the current selection colour to a desired colour. - Text Fields: Text fields are often configured for headings to be displayed on the plot. They will vary in names but will be available above the plot preview section. These fields are entered as free text.
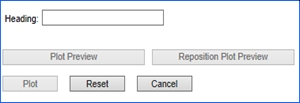
Fig: Text Field Plot Application - Plot Preview: The area of the map that will be plotted can be previewed and modified by selecting the Plot Preview. The Plot Preview will display a red box at the centre of the map to indicate the area that will be plotted. The plot preview options are not available when you select to plot by feature centre.
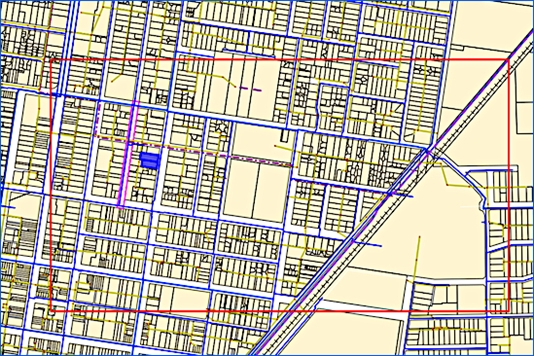
Fig: Plot Preview - Reposition Plot Preview: To move the plot area, select the Reposition Plot Preview option. The focus changes to the map window and the cursor becomes a marker. Click where the centre of the new plot area should be, the previous plot area location will be outlined by a green box.
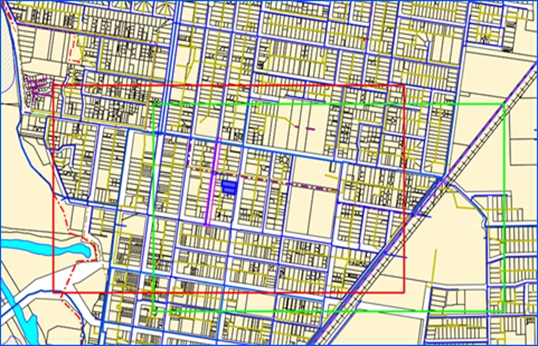
Fig: Reposition Plot Preview - Plot: On selecting Plot the window shown below will appear.
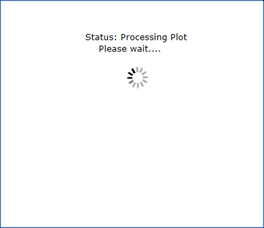
Fig: Plotting Applications Status Window
This window confirms that the plot is in progress. Once finished, a PDF will be returned. The time required for the plot to return is depending on the number of layers, scale and number of pages for which the plotting will occur.Note: On Android tablets, Chrome is the suggested browser. The user should ensure a PDF viewer is installed on the device. Once plotting is done, the pdf will be downloaded and can then be opened. The plotting applications status window will continue processing however this superfluous window can be closed. 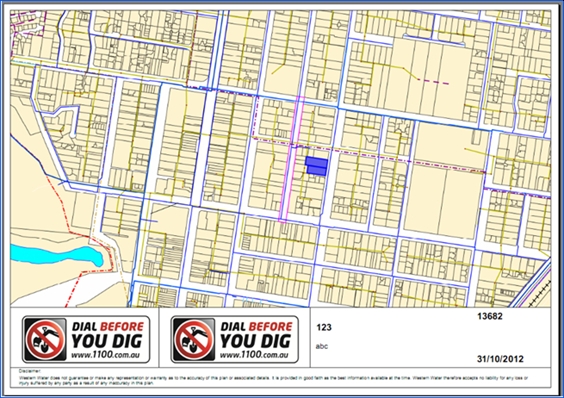
Fig: Output PDF from General PlottingNote: Selected objects within the map view will appear differently in the plot output. The selection style is configurable by the administrator. - Email: An option to send plots to an email address can be configured by your Open Spatial consultant. If this is configured when you select the Plot button an email will be sent automatically.
- Reset: The Reset button will remove any information that has been entered in the plot application dialog box and restore defaults.
- Cancel: The Reset If you click Cancel the plot application dialog box will be closed.
- Auto Scale: Auto scale uses a value that is pre-defined by your administrator when selected.
Layer Filter available for Plots
When a layer filter is active, then within the plot window a check box will be displayed, prompting the user to decide if the active filter should be applied to the plot. This means that the plot will be generated based on the filter results which is active in the layer filter tool.
Layer Filtering is available for both general and pre-defined plots.
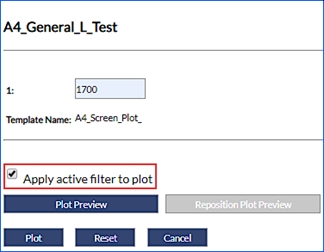
Fig: Layer Filter optional for General Plots
 Bookmarks
When the Bookmark icon is selected, the Defined bookmarks options will load as a floating pane on the user’s screen which is a new built-in function on enlighten. This floating pane allows the user to be dragged and placed at a convenient location as per the user’s preference. This pane can also be minimized or expanded, thus keeping this active whilst the user continues with other actions on enlighten. Lastly, this floating pane can also be made transparent thereby enabling the user to dock this anywhere on the map without obstructing other panes.
The bookmarks available in the drop-down list are those bookmarks that have been saved as Public Bookmarks or those that the user has saved as their own Private Bookmarks. After you navigate to a specific location on the map, you can save the current view of the map as a bookmark. A bookmark saves all the information about the current view of the map under a name you specify. By using the bookmark in the future, you can go directly to this same view of the map without having to zoom and pan again.
Save a New Bookmark
To save a new bookmark, first navigate to a location on the map and then save the current view of the map under a name that you specify. The bookmark names must be unique and not longer than 40 characters in length.
- Select the Bookmark icon.
- Select the New button from the Defined Bookmarks options.
- Enter in a bookmark name in the text box.
- Select whether the bookmark is Private or Public.
- Select the Save button.
- The Bookmark is saved to the database for future use.
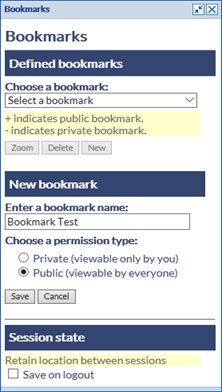
Fig: Defining a new Bookmark - The Session State tick-box option Save on Logout will, if checked, retain the last zoomed map location (screen center X;Y position and map scale), and return to the same map location and zoom scale when the user opens a new enlighten session.
Zoom to a Bookmark
To zoom to a previously saved bookmark you simply select the Bookmark icon from the toolbar and follow the steps below.
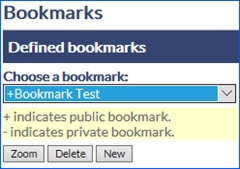
Fig: Zoom to a saved Bookmark
- Select the Bookmark icon.
- Choose a Bookmark name from the drop-down list.
- Select the Zoom button
- The map zooms to the map extents of the bookmark when it was saved.
Delete a Bookmark
To delete a Bookmark, you simply select the Bookmark icon from the toolbar and follow the steps below. The Bookmarks can only be deleted one at a time.
- Select the Bookmark icon.
- Choose a Bookmark name from the drop-down list.
- Select the Delete button
- A confirmation message is displayed where the OK button will delete the Bookmark from the database and the Cancel button will cancel the deletion and return to the map.
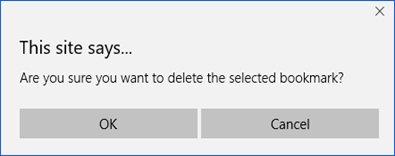
Fig: Confirmation message when deleting a BookmarkNote: The Bookmark functionality is not available to external users and will only be visible to internal users. For more information on User types please refer to Manage Users and Permissions in the enlighten Administrators Guide.
Geo-scan Images
The Munsys Geo-scan Tools provides Munsys users with a set of functions to capture previously scanned images, for example Engineering as-constructed survey plans, PDF's and DWG files as part of the Munsys data model. This is done in the AutoCAD environment using Spatial Data Manager, where the various functions have been added to the Capture and Change menus. These menu functions allow users to insert, align, scale, and rotate the As-Constructed image/PDF/DWG files so that they are in the correct geographic location to be used as underlying references to capture the spatial location of asset information, and use the markups on the plans to capture required attribute information.
Open Spatial’s enlighten web application enables users to display Munsys Geo-scan images as geo-located underlays within the enlighten web browser map. There are some additional steps required to convert scanned TIF/JPG/JPEG/PDF files to GeoTIFF images which geo-references the image to the correct geographical location with the required scale and rotation angle so that the asset information on other configure enlighten layers can be displayed on top of the Geo-scan image. The conversion process is covered in the FAQ section of the Open Spatial Website.
Viewing Geo-scan Images in enlighten
The Geo-scan boundaries are stored in the spatial table SP_GEOSCAN_BNDRY and can be authored as a layer in enlighten to display the extents of the coverage of the Engineers scanned image. These layers can be authored based on coverage size, or categories assigned to the images based on the utility information appearing in the image, or any other spatial or attribute criteria. For the purposes of the examples below, the layers have been authored based on the coverage extent of the Geo-scan images.
The user can select objects located at a specific location, such as a street intersection, and views the list Geo-scan images which intersect that intersection on the Advanced forms based on the selection set and which layers are switched on for display. The original scanned image can be viewed using the hyperlink setup on the Advanced Form and can also view the scanned image which has been geographically referenced, scaled, and rotated in Munsys. The Geo-scan layer is inserted just above the topmost raster or tileset layer for display purposes so that all utility layers can be viewed on top of Geo-scan layer.
This enables the capture, integration, and use of scanned Engineering plan images for utility asset inventory recording and other applications. By having the ability to display these scanned plans as back drop images, it improves work efficiency and provides a way to determine which source documents cover a specific geographic area all within a single web browser application. It also provides an electronic filing system where Engineering As-Constructed scanned images can be easily retrieved and viewed from the central server from a single source.
 Load Geo-scan
To Load a Geo-scan image, follow these steps:
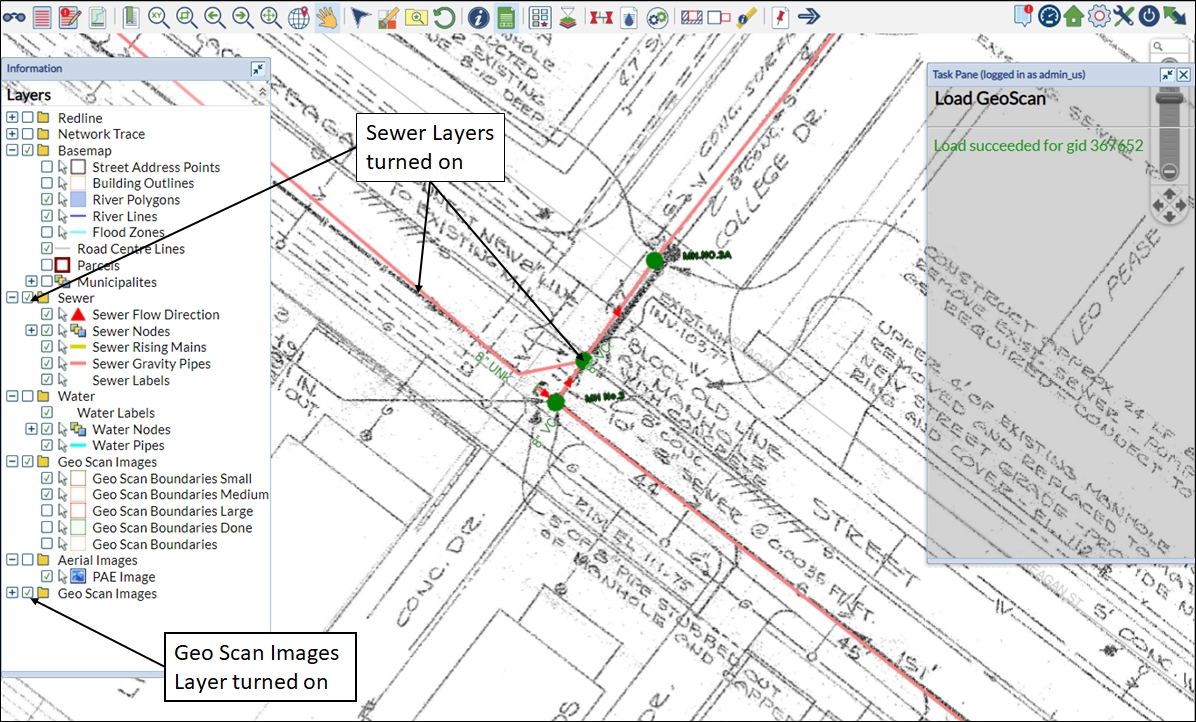
Fig: Utility data is displayed on top of the As-Constructed Image
- Zoom into a specific location on the map, switch on the required map layers to display utility information such as the sanitary sewer pipes as well as the Geo-scan boundaries, and then select all objects for the specific intersection on the map to be displayed in the Advanced Forms.
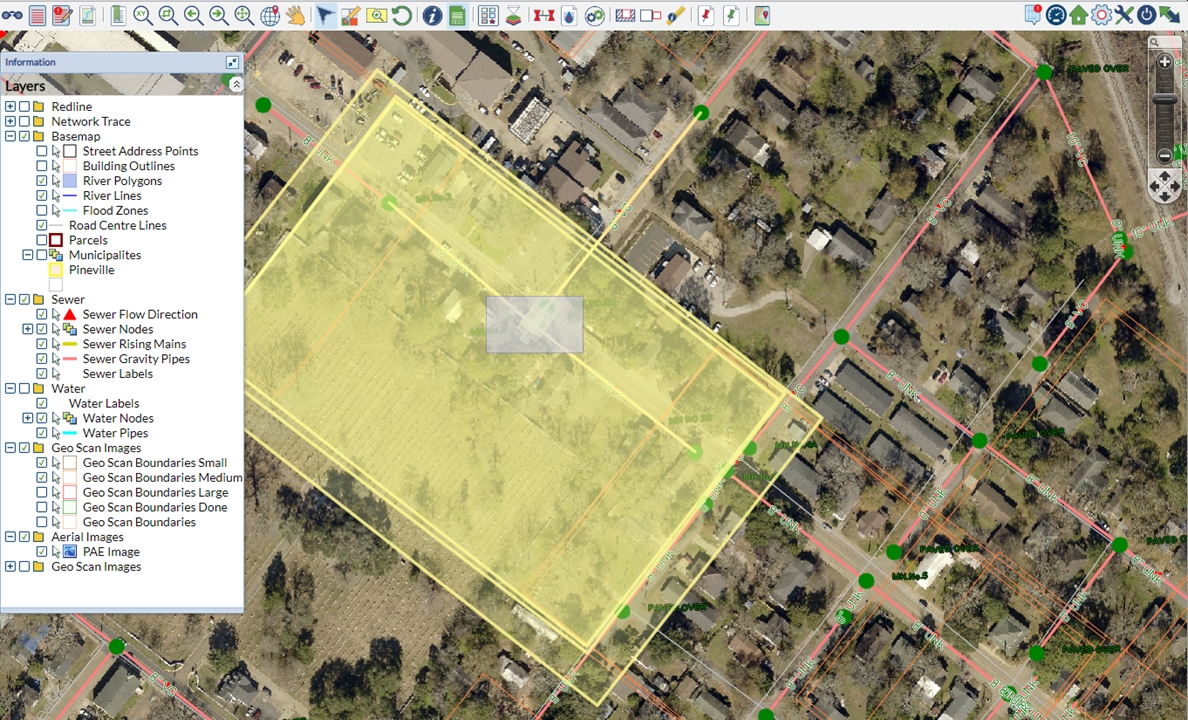
Fig: Selection of Geo-scan boundary objects crossing a specific street intersection - Select the required Geo-scan boundary, for example the boundary with the Sewer and Water Network utilities, and then select the hyperlink to display the original scanned Engineers As-Constructed plan.
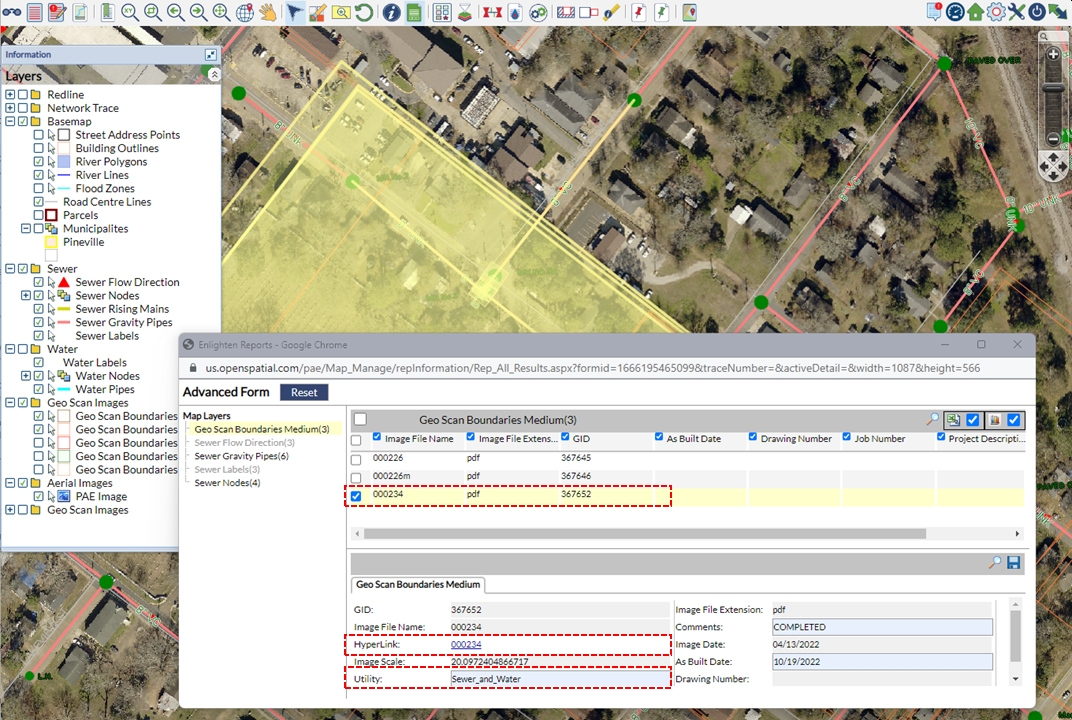
Fig: Select the Geo-scan hyperlink on the Advanced Form - The original scanned image is loaded in a separate window in the format it was scanned to, either TIF/JPG/PDF, where you can then zoom in and navigate around the scanned image to pick up critical information and notations.
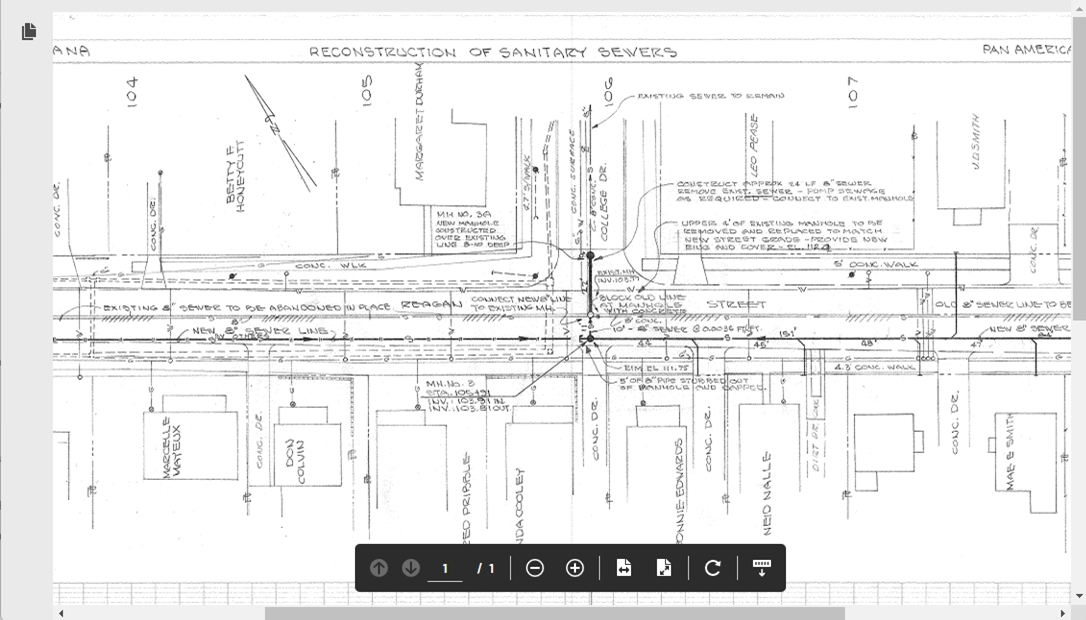
Fig: Viewing Original Geo-scan Image - If the Advanced Form is setup to display the Image Preview for URL type columns, as soon as the Advanced Form is selected for the configured layer, the Image Preview box is displayed ontop of the Advanced Form window. The user can close the window by selecting the
 in the window, or the user can select the View in full window button to display the original linked document.
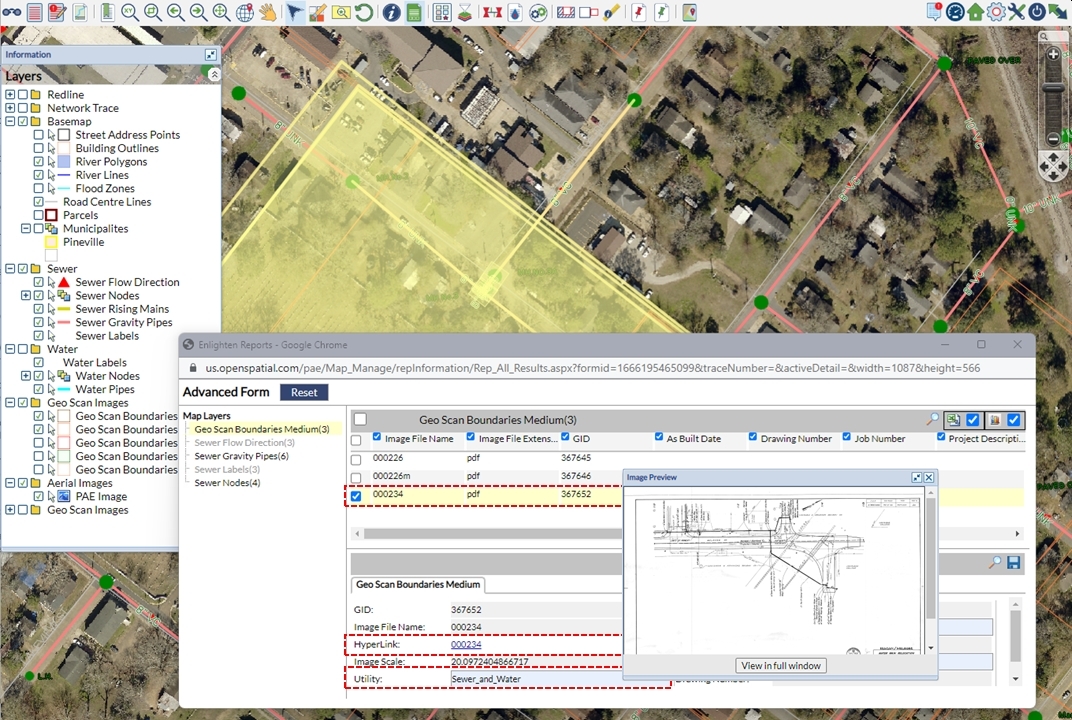
Fig: Image Preview for Geo-scan hyperlink on the Advanced Form - By selecting a single Geo-scan record in the list on the Advanced Forms, you can then navigate to the selected record in the map by selecting the Zoom to Map
 icon. The map will display the extents of the selected Geo-scan boundary.
 - Right click on the object and select the Load Geo Scan
 from the context menu to load the scanned image as a back-drop on the layer Geo Scan Images. The Geo-scan layer is inserted just above the topmost raster or tileset layer for display purposes so that utility layers can be viewed on top of Geo-scan layer
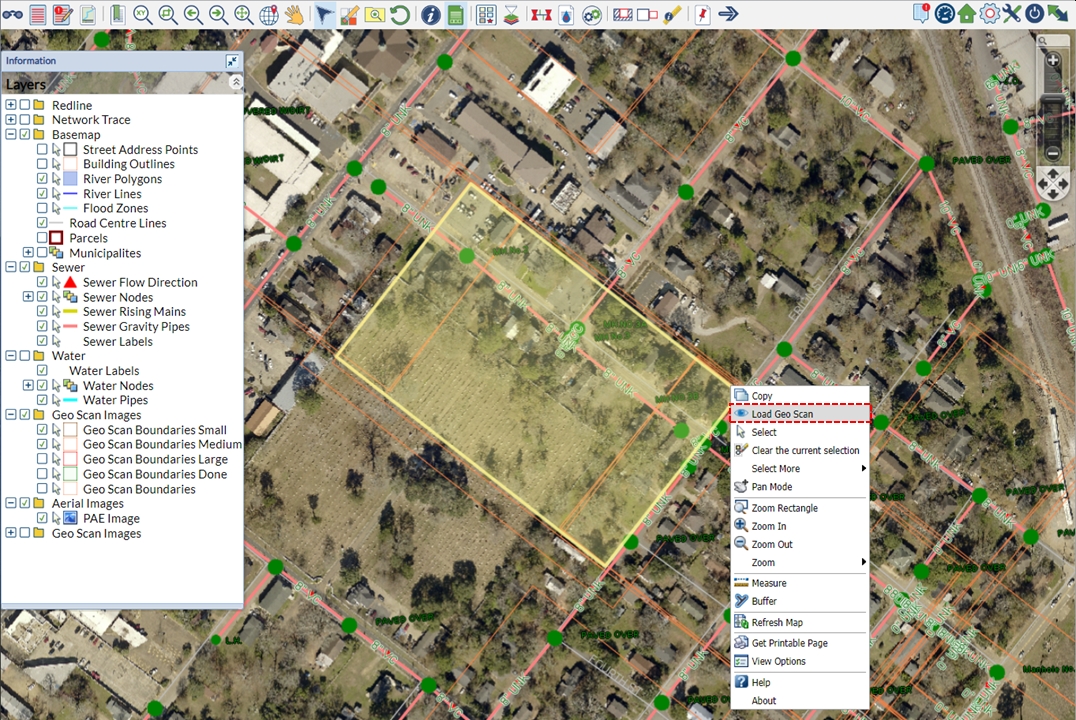
Fig: Load the Geo-scan image from the Context Menu - You can zoom in and out of the map while navigating around the scanned As-Constructed Engineering image to check that what has been captured in the GIS spatial tables matches what was constructed in the field.