 Layer Controls Pane
The Layers pane displays the list of layer groups and layers available within the map. It also acts as a legend by showing how each feature is displayed graphically on the map. Permission to view the Layer Groups and individual Layers are assigned by the Administrator in the Manage User and Permissions.
In the event the Layers pane is not fully opened scroll bars are displayed at the bottom of the pane to scroll left and right, and to the right of the pane to scroll up and down. This allows the user to maximum space on the map where they do not have to manually resize the pane to navigate the layer groups and layers displayed in the pane. The Layers pane level of transparency can be set in the Set User Options allowing the underlying map and layers to display partially or fully through the pane.
What is a Layer?
A layer is usually a group of objects that belong to a specific thematic category and is of the same geometric type. For example, all sewer pipes are stored in one layer but are on a different layer to water pipes or to sewer nodes.
It is possible, however, to sort layers into Layer Groups in order to display objects together that have different geometric types but share a common theme: for example, water pipes, water nodes, and water valves belong to the layer group Water.
Vector layers are classified into different geometric type, these being text, point, line or polygon. However, if text displayed on the map is not selectable, it is probably not a text layer but a text label of a point, polygon or line.
Layer Ordering
Once the layers have been organized into groups such as Sewer or Water etc., all the related data-sets will be listed under the layer group header.
When required, the enlighten Administrator can add new layers and layer groups, as well as change the order in which the layers display within or between layer groups.
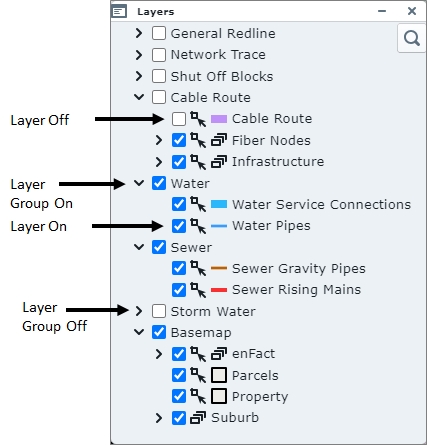
Fig: Layer Control Bar
Layer Filtering and Searching
On the Layers pane, there is an option to Filter/search for layers or groups based on the entered layer name. This filter ![]() when selected, allows the user to search the layers in the list by typing in the first couple of characters of a layer name, where the resultant list is filtered to display only matching layers. The user can then navigate quickly to the desired layer to turn the layer on/off as required.
when selected, allows the user to search the layers in the list by typing in the first couple of characters of a layer name, where the resultant list is filtered to display only matching layers. The user can then navigate quickly to the desired layer to turn the layer on/off as required.
The below example indicates the results of where a filter has been applied on the layer groups and layer containing the word ''connections''.
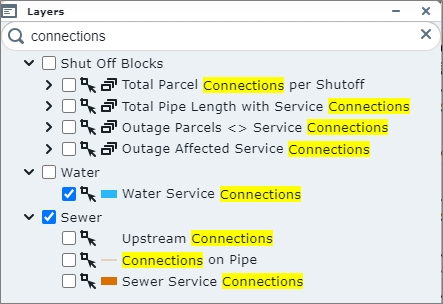
Fig: Layer search and filter on layers containing the word 'connections'
Layer Scale Dependency
Map layers can be set to become visible only at a certain map scale to enhance performance and presentation clarity. In other words, the more you zoom in, the more layers and features are displayed. For example, suburb boundaries may be visible at a scale of 1:60,000, land parcel outlines at a scale of 1:30,000 and roads at 1:6,000. Typically text features would only be made visible at a scale where they do not overlap other text features and where they are easy to read in conjunction with the feature they are describing.
By setting scale dependencies on each layer, map loading speed is improved, and a more effective display of map features is provided. Your enlighten Administrator can set the scale dependencies as required.
Turning Layers and Layer Groups On/Off
A layer or layer group is turned on when the tick-box next to the layer group or layer name is checked. Those layers which are listed but not displayed in the map can be turned on by ticking the box next to them.
When a layer is turned on it will expand to show its legend symbol.
Fig: Layer Group On
Setting Layers as non-selectable
By clicking on the selection layer icon ![]() next to individual layer tick-boxes in the Layers pane, the user can set the layer to be non-selectable. If the layer forms part of a selection on the map, none of the map features authored on that layer are included in the Selection set. The layer icon changes to
next to individual layer tick-boxes in the Layers pane, the user can set the layer to be non-selectable. If the layer forms part of a selection on the map, none of the map features authored on that layer are included in the Selection set. The layer icon changes to  indicating the layer is now non-selectable. This is a temporary setting for the user's session or until the selection icon is selected again, whereby the layer becomes selectable again.
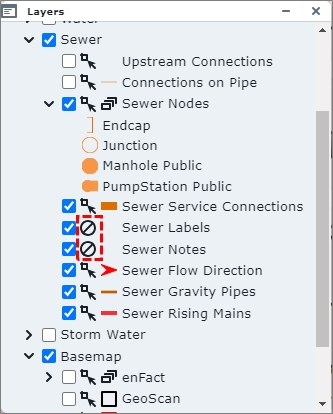
Fig: Setting Layers to be non-selectable
 Add External and Local Layers pane
The Add External and Local Layers option ![]() allows users to set the background map or External Provider on which their own spatial data will be displayed. OpenStreetMap is a free, editable map of the whole world created by a community of mappers who contribute and maintain mapping data. Bing™ Maps is a web mapping service provided by Microsoft's Bing suite of search engines and powered by Bing Maps Platform framework. Both of these frameworks are free to view as background information in enlighten.
allows users to set the background map or External Provider on which their own spatial data will be displayed. OpenStreetMap is a free, editable map of the whole world created by a community of mappers who contribute and maintain mapping data. Bing™ Maps is a web mapping service provided by Microsoft's Bing suite of search engines and powered by Bing Maps Platform framework. Both of these frameworks are free to view as background information in enlighten.
All external layers added during the enlighten session are temporary and are removed from the Layers pane once the enlighten session is closed. These external layers are also not available for inclusion in the enPlot Plot Engine function ![]() available on the enlighten Toolbar, however, the layers are included when doing a Quick Plot since the Quick Plot function uses whatever is currently displayed on the screen to create a print screen plot.
available on the enlighten Toolbar, however, the layers are included when doing a Quick Plot since the Quick Plot function uses whatever is currently displayed on the screen to create a print screen plot.
There may be some additional licensing requirements to consider before the external providers can be configured for display. Please consult the enlighten Admin Guide for details on configuration. Below are some examples of the external provider options that are configured by default:
- NONE
- Open Street Maps
- Bing™ Maps Street
- Bing™ Maps Aerials
- Bing™ Maps Aerials (with Labels)
- World Imagery
- Mapbox Satellite
- Mapbox Streets
If the External Provider is set to NONE, no background is displayed at all. Below is an indication of the various external providers available from the drop-down list and what is displayed in terms of features.
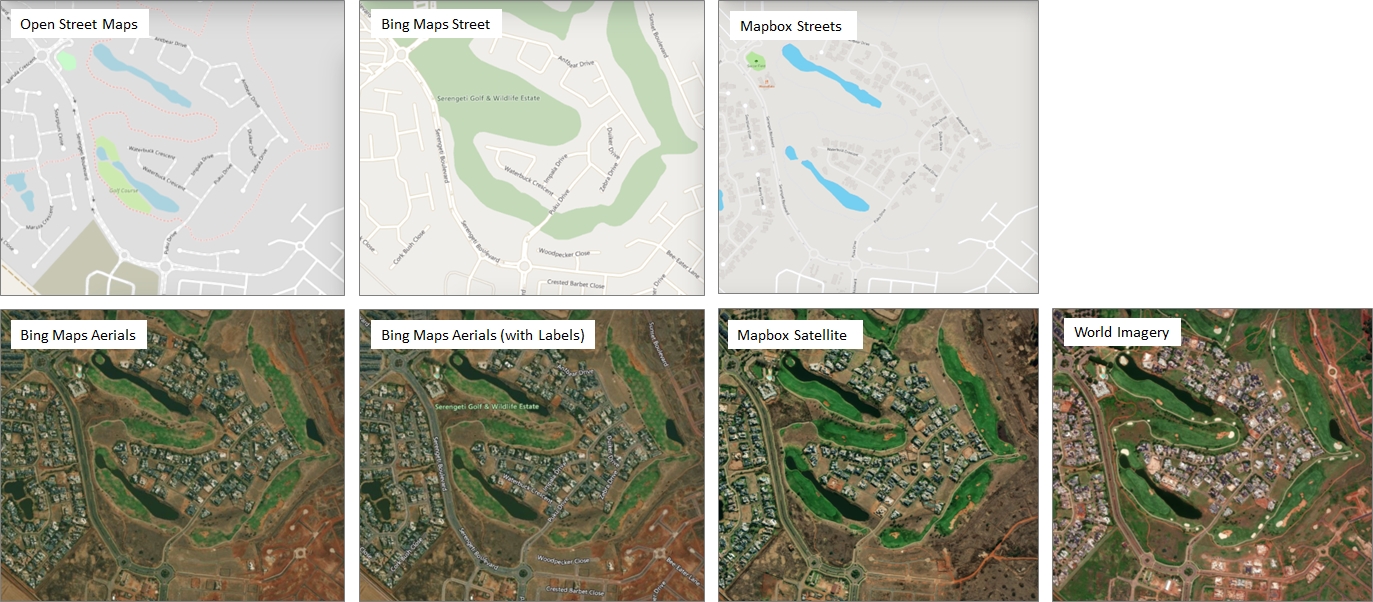
Fig: Different External Providers available
The following Local file-based layer formats are supported:
- GeoJSON/TopoJSON
- KML
- GPX
- IGC
Adding an External Provider background
To assign a background map from External providers, follow these steps:.
- Select the Add Layers icon from the Main Toolbar.
- On the Add/Manage Layer pane, select the drop-down list next to the External Provider.
- Select one of the options on the list and the background is immediately applied to the map.
- Once the required background map is applied, close the Add/Manage Layer pane.
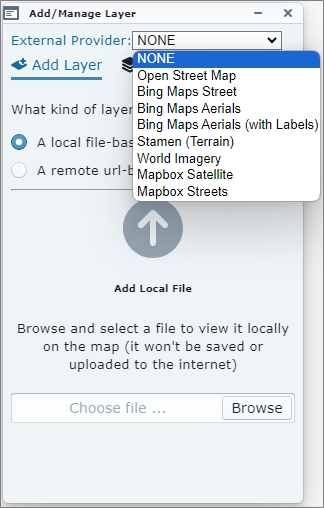
Fig: Select an External Provider from the drop-down list
Adding a KML Local file-based layer
To add a Local file-based layer:
- Select the Add Layers icon from the Main Toolbar.
- Ensure the Add Layer tab
 at the top of the Add/Manage Layer pane is active.
 - Click the radio button next to A local file-based layer button.
- Select the Browse button and navigate to the required file location and select Open File.
The file details will load in the Add/Manage pane.
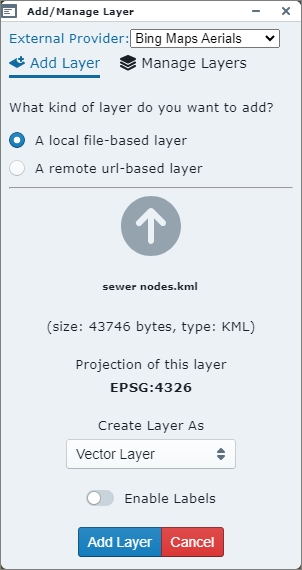
Fig: Search Menu Side Pane - Select the Add Layer button at the bottom of the Add/Manage Layer pane.
- The layer will load as a temporary layer for the enlighten session.
- Select the Manage Layers tab
 at the top of the Add/Manage Layer pane to switch the layer on/off
  , delete the temporary layer
  or to set the layer transparency settings
  .
.
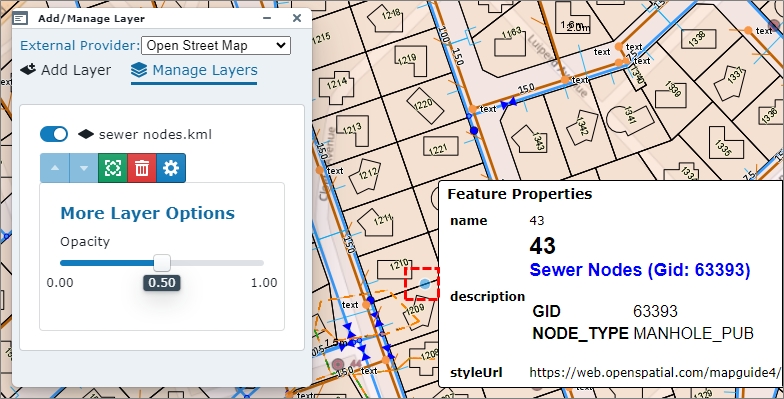
Fig: Manage Layers
Adding a Web Map Service (WMS) Layer
The OGC Web Map Service (WMS) is a service hosted on a remote server used to publish a collection of map layers to embed in your interactive web maps. Similar to a website, you can access the WMS layer as long as you have a connection to the server defined. The WMS specification expresses the map contents as map layers using XML. The primary use of the WMS is to openly serve interactive map images on the internet.
The following WMS versions are currently supported.
- WMS Version 1.1.
- WMS Version 1.2.
- WMS Version 1.3.
To add a WMS layer as an external layer, complete the steps below:
- Select the Add Layers icon from the Main Toolbar.
- Ensure the Add Layer tab at the top of the Add/Manage Layer pane is active.
- Click the radio button next to A remote url-based layer button.
- Select WMS from the drop-down list for Layer Type.
- Enter the URL for the WMS Layer to be added, for example

- The Authentication tick-box is available for selection in the event login credentials are required for the selected service.
- Select the blue arrow next to the entered URL to load the Available WMS Layers.
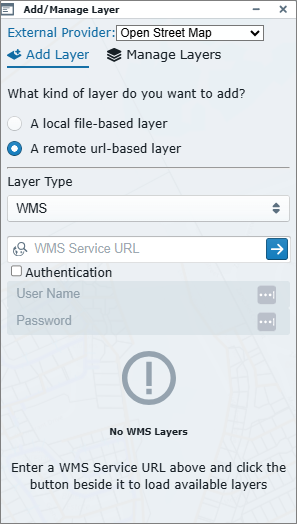
Fig: Adding Web Map Service (WMS) layer - Once the Available WMS Layer/s are displayed in the pane, select the option to Add layer ([layer name...]) or Add tiled layer (([layer name...]), or continue scrolling down the list to select the required layer to add.
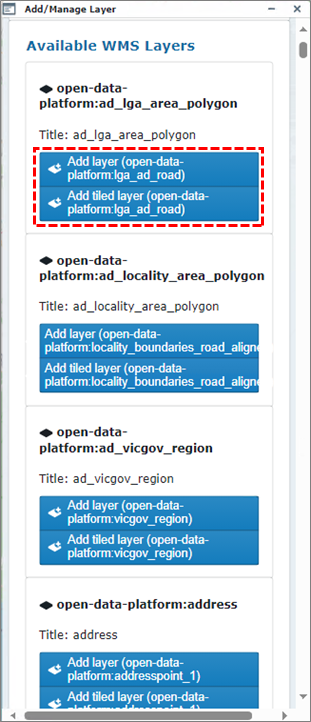
Fig: Adding Web Map Service (WMS) layer - The WMS Layer is added to the Layers pane as an additional External layer where the layer can be switched ON/OFF, and the layer features are displayed in the base map. The External Provider layers for WMS are added as back-drop below the customer defined layers.
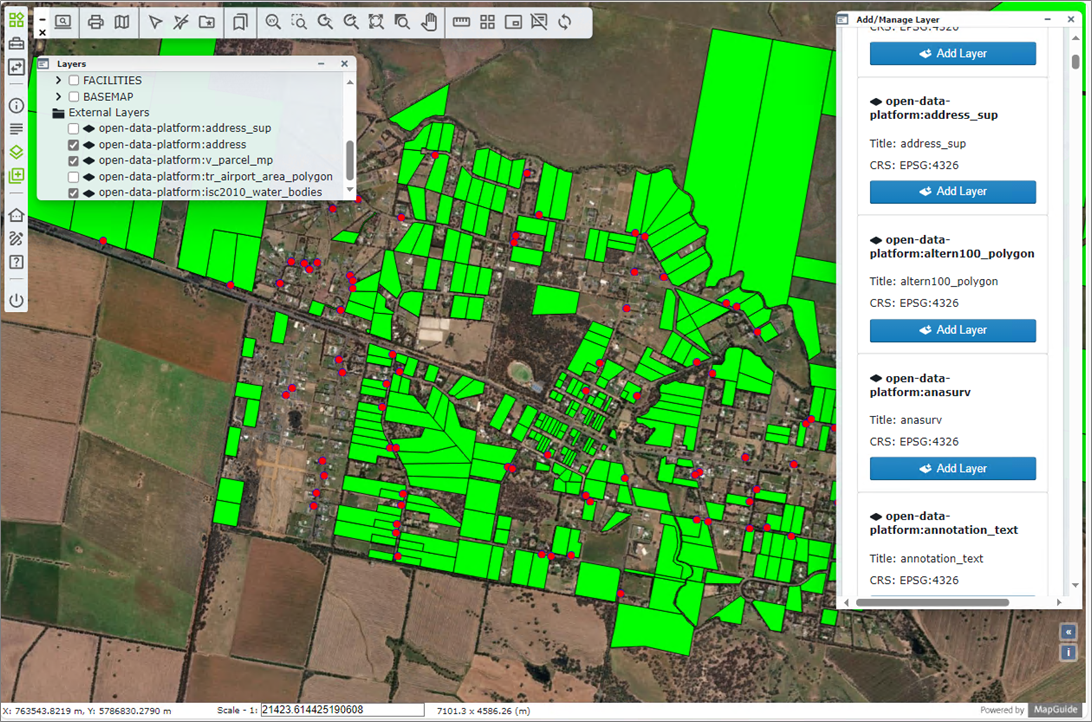
Fig: WMS Layer added to Layers pane and displayed in the base map - Some WMS layers have been set to display a specific scales, so if the WMS layer does not display, check the metadata to consult specific instructions.
- Selecting the Manage Layers option at the top of the Add/Manage Layers pane provides additional tools as detailed below:
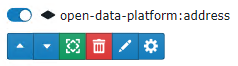
Fig: Add/Manage Layer options-
 Display layer On/Off.
 -
 Moves layer up the draw order. (Only available if more than one layer is loaded)
 -
 Moves layer down the draw order. (Only available if more than one layer is loaded)
 -
 Zoom to the extents of the layer.
 -
 Remove the layer.
 -
 Edit the default style for the selected layer.
 -
 Show more layer options.
-
- When selecting the Edit style option the user can set the way the Point, Line, or Polygon object is displayed in terms of style settings.
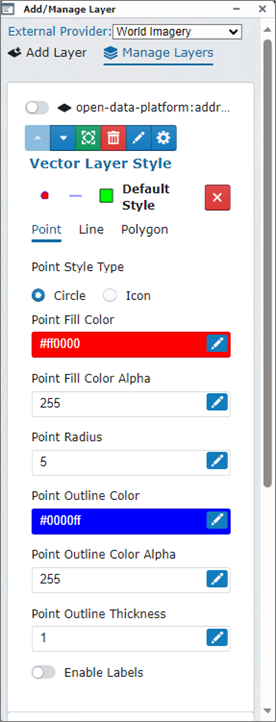
Fig: Add/Manage Layer Point style options
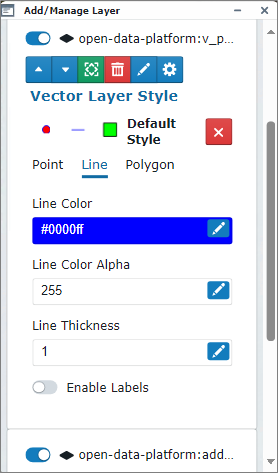
Fig: Add/Manage Layer Line style options
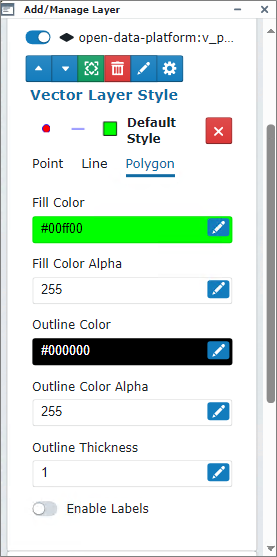
Fig: Add/Manage Layer Polygon style options
Adding a Web Feature Service (WFS) Layer
The OGC Web Feature Service (WFS) is a standard protocol for serving Geospatial data as vector features with geometry and attributes which clients can use in Geospatial analysis. WFS allows clients to request specific feature data from a server and display the features as an external layer in the layer pane to be used as backdrop information.
The following WFS version is currently supported.
- WFS Version 2.0.
To add a WMS layer as an external layer, complete the steps below:
- Select the Add Layers icon from the Main Toolbar.
- Ensure the Add Layer tab at the top of the Add/Manage Layer pane is active.
- Click the radio button next to A remote url-based layer button.
- Select WFS from the drop-down list for Layer Type.
- Enter the URL for the WMS Layer to be added, for example

- The Authentication tick-box is available for selection in the event login credentials are required for the selected service.
- Select the blue arrow next to the entered URL to load the Available WMS Layers.
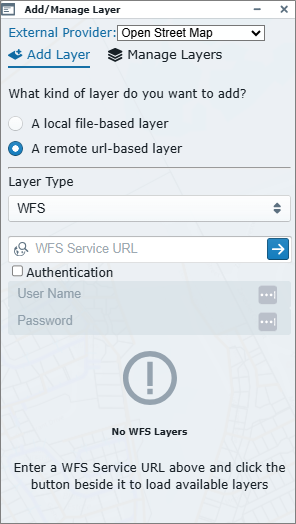
Fig: Adding Web Feature Service (WFS) layer - Once the Available WFS Layer/s are displayed in the pane, select the option to Add layer or continue scrolling down the list to select the required layer to add.
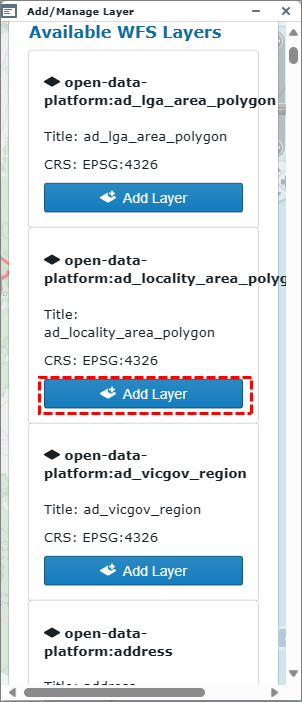
Fig: Adding Web Feature Service (WFS) layer - The WMS Layer is added to the Layers pane as an additional External layer where the layer can be switched ON/OFF, and the layer features are displayed in the base map. The External Provider layers for WFS are added as back-drop below the customer defined layers.
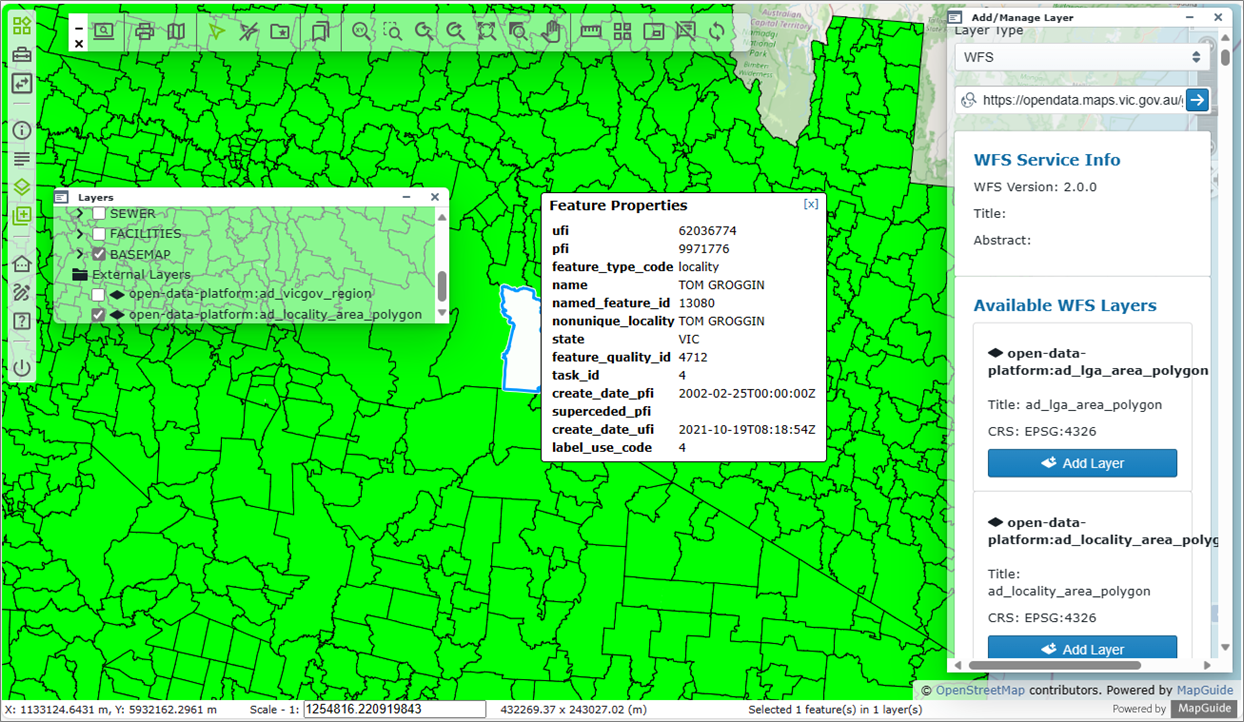
Fig: WFS Layer added to Layers pane and displayed in the base map - The WFS layers allow users to select a feature on the map to display the associated attribute information in a pop up text box.
- Selecting the Manage Layers option at the top of the Add/Manage Layers pane provides additional tools as detailed below:
Fig: Add/Manage Layer options- Display layer On/Off.
- Moves layer up the draw order. (Only available if more than one layer is loaded)
- Moves layer down the draw order. (Only available if more than one layer is loaded)
- Zoom to the extents of the layer.
- Remove the layer.
- Edit the default style for the selected layer.
- Show more layer options.
-
- When selecting the Edit style option the user can set the way the Point, Line, or Polygon object is displayed in terms of style settings.
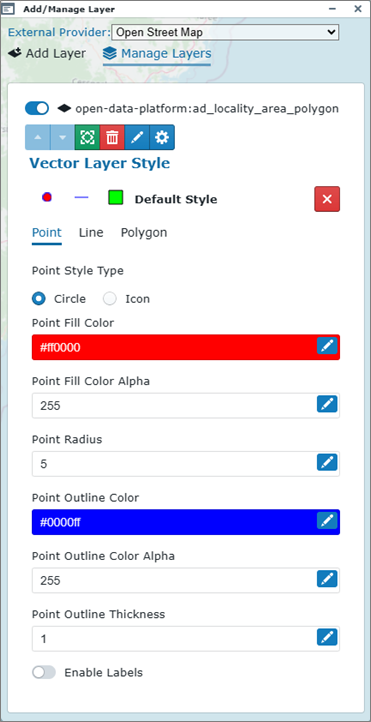
Fig: Add/Manage Layer Point style options
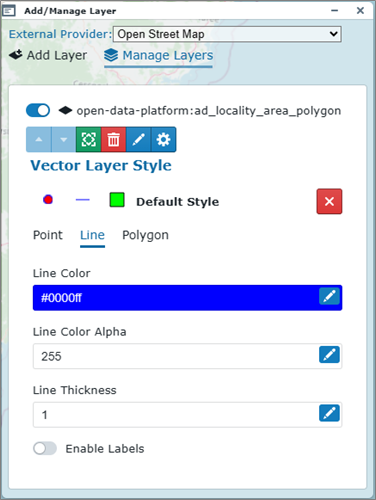
Fig: Add/Manage Layer Line style options
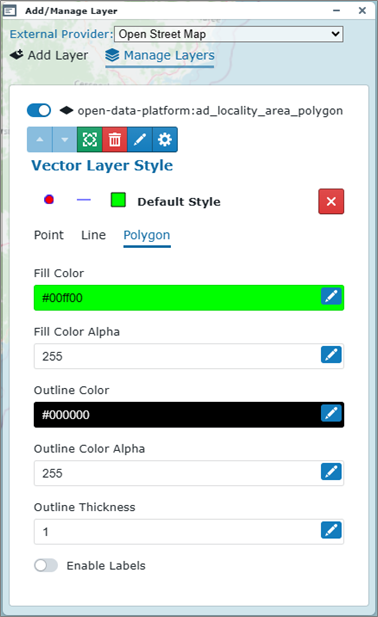
Fig: Add/Manage Layer Polygon style options
Adding an ESRI Feature Service Layer
The ESRI Feature Service serves feature data over the internet to make them available for use in web clients and field applications. The REST endpoint (URL) for the required ESRI Feature Service is unique per customer and configurable as part of the Enlighten settings by the Enlighten Administrator. The ESRI Feature Service is ESRI's standard protocol for serving Geospatial data as vector features with geometry and attributes which clients can use in Geospatial analysis and run on ArcGIS GIS Server sites. WFS allows clients to request specific feature data from a server and display the features as an external layer in the layer pane to be used as backdrop information.
To add an ESRI Feature Service layer as an external layer, complete the steps below:
- Select the Add Layers icon from the Main Toolbar.
- Ensure the Add Layer tab at the top of the Add/Manage Layer pane is active.
- Click the radio button next to A remote url-based layer button.
- Select ESRI Feature Service from the drop-down list for Layer Type.
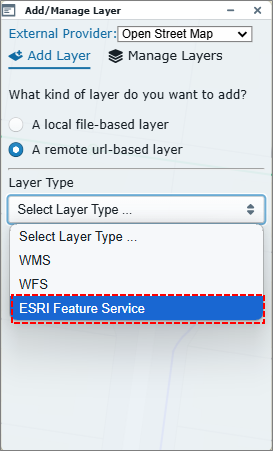
Fig: Select ESRI Feature Service - Enter the REST Endpoint (URL) forms part of the Enlighten configuration and will automatically display if the default URL is configured. Alternatively, the user may manually enter the URL for the required service.
Note: Please contact your Enlighten Administrator to configure the default ESRI Feature Service URL in the event it is not displayed when the Layer Type is selected. - Select the Arrow button adjacent to the entered REST endpoint to retrieve the list of available ESRI Layers.
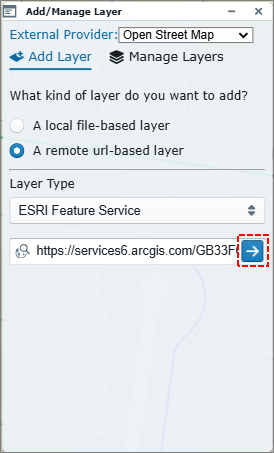
Fig: Enter ESRI Feature Service REST endpoint - Select a layer from the drop-down list of available ESRI Layers.
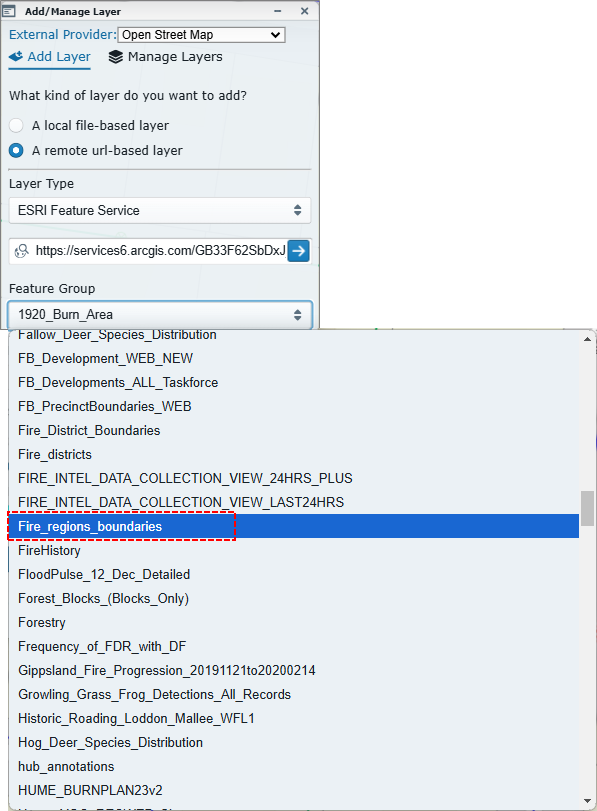
Fig: Select ESRI Layer - Upon selecting the layer, the user has the option to apply simple color formatting to the selected Feature.
- The user can opt to select the radio button next to Different Colors which applies a different random colour for each Feature displayed in the map when the user selects the Add Layer.
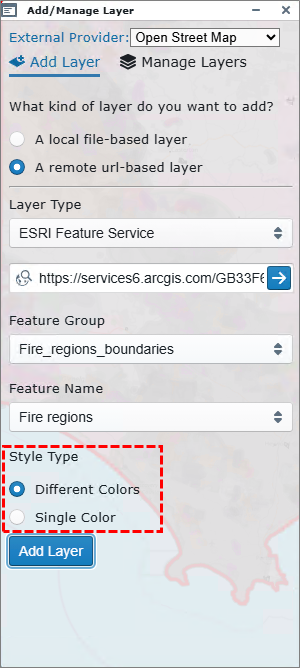
Fig: Apply Different Color formatting - Select the Add Layer button. A message is displayed at the top of the screen confirming the selected layer has been added, and the layer is added to the Layers pane.

- The end result of adding the layer and opting for the Different Colors formatting is as per below for the selected Fire Regions.
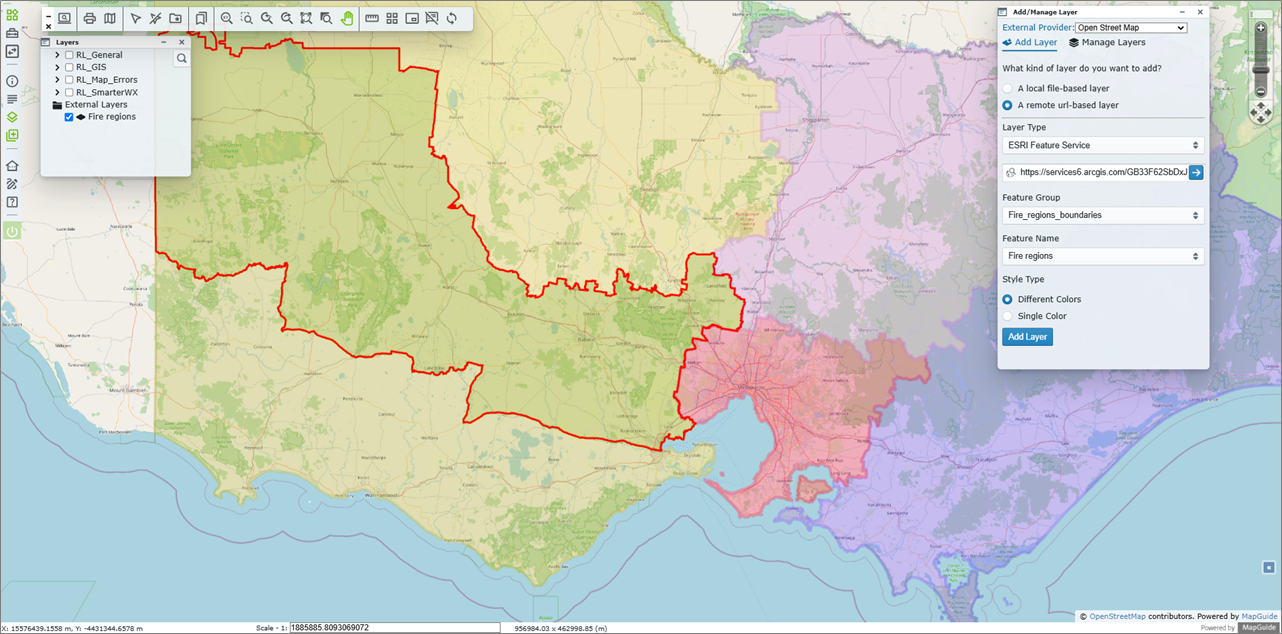
Fig: Features displayed with Different Colors - The user can also opt to select the radio button next to Single Color which allows the user to select the required color from the HEX color picker and then Apply to the selected Feature Layer, and then select the Add Layer button to add the layer to the map.
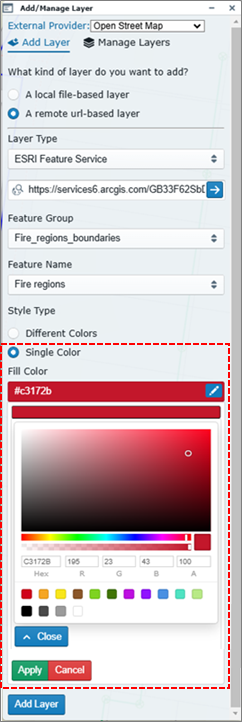
Fig: Apply Single Color formatting - The end result of opting for the Single Color formatting is as per below for the selected Fire Regions
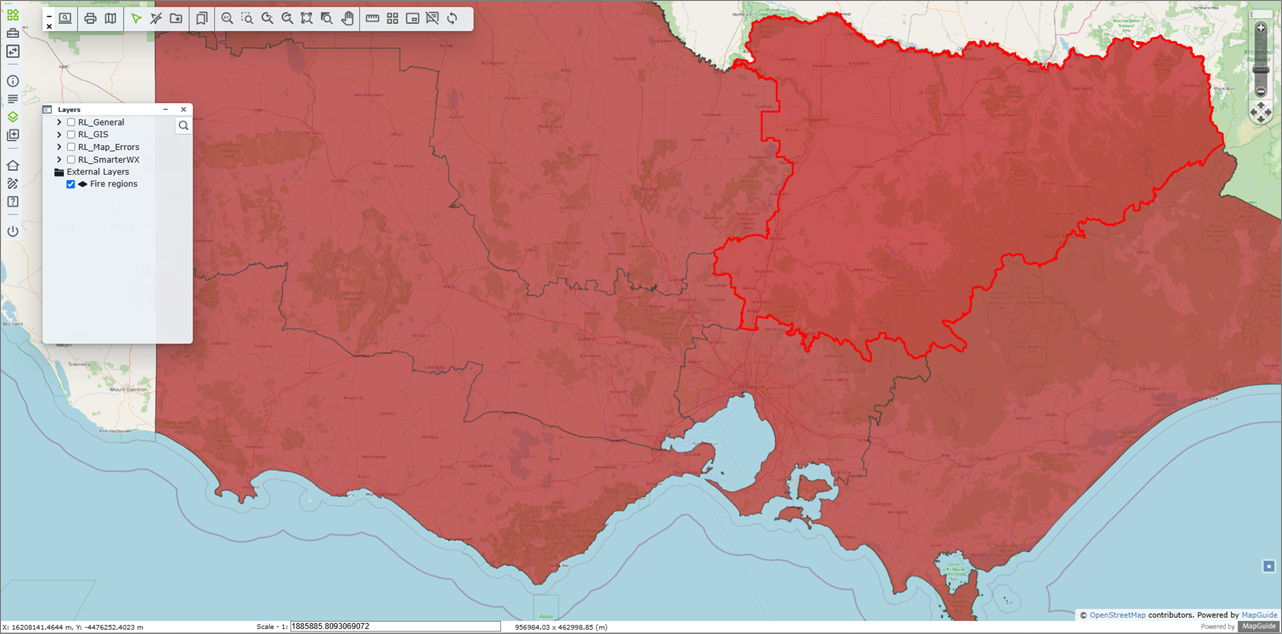
Fig: Features displayed with a Single Color - Selecting the Manage Layers option at the top of the Add/Manage Layers pane provides additional tools as detailed below:
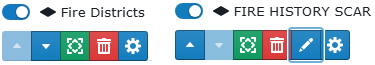
Fig: Add/Manage Layer options for ESRI Feature Layers- Display layer On/Off.
- Moves layer up the draw order. (Only available if more than one layer is loaded)
- Moves layer down the draw order. (Only available if more than one layer is loaded)
- Zoom to the extents of the layer.
- Remove the layer.
- Edit the default style for the selected layer. (Not available for all layers)
- Show more layer options.
-
- If availbale, when selecting the Edit style option , the user is limited to changing the default style Fill and Outline colors, and Outline Thickness.
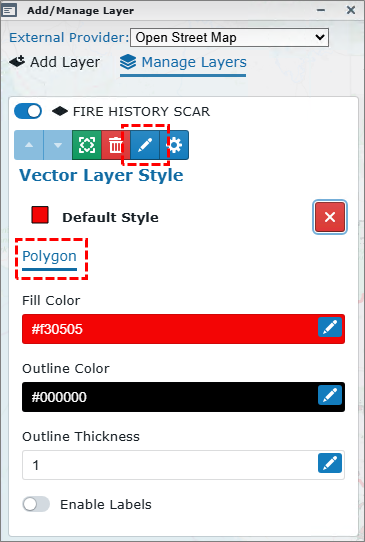
Fig: Add/Manage Layer Point style options for ESRI layers
Restoring an ESRI Feature Service Layer
Once an ESRI Feature Source layer has been added, on the next login, the user has the option to reload the last ESRI Feature Source layer, or to restore any added layers by updating their User Options.
The scenario below details how to reload the last ESRI Feature Source layer if the User Options have not been set to Restore Added Layers:
- Select the Add Layers icon from the Main Toolbar.
- Ensure the Add Layer tab at the top of the Add/Manage Layer pane is active.
- Click the radio button next to A remote url-based layer button.
- Select ESRI Feature Service from the drop-down list for Layer Type.
Fig: Select ESRI Feature Service - Once the Add / Manage Layer pane loads, the option to Load Last is available for selection.
Note: This option will simply load the last Layer added, so in the event multiple layers were added, only the last one is loaded.
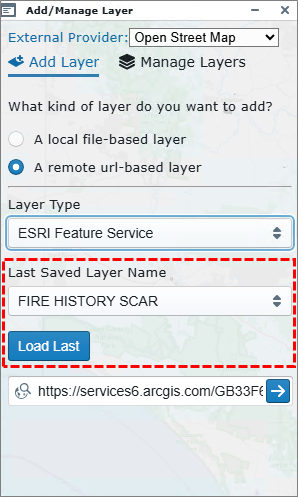
Fig: Load Last ESRI Feature Source Layer - Select the Load Last option where the last layer is loaded in the Pane ready to apply a style.
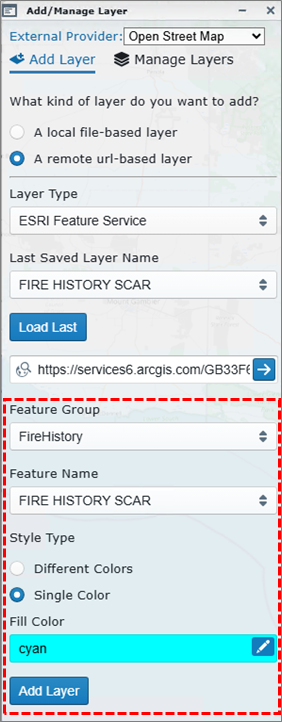
Fig: Apply the style before adding the layer - Select the Add Layer button to add the layer to the map.
The scenario below details how to set the User Options so that any added layers are loaded on next login:
- Select the enlighten Task Pane icon
 from the Main Toolbar.
 - Select the Set User Option icon
 on the Enlighten Task Pane.
 - Select the tick-box next to the Restore Added Layers option.
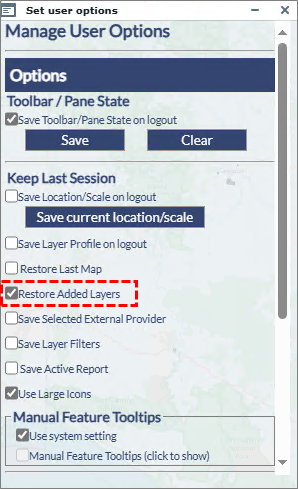
Fig: Check the option to Restore Added Layers - When the user opens their next Enlighten session, any added layers will be loaded automatically and will appear on the Layers pane.
Removing Remote URL-Based Layers
Any WFS, WMS or ESRI Feature Source layers added using the Add/Manage Layers pane can be switched off or permanently removed using the Manage Layers option.
- Select the Add Layers icon from the Main Toolbar.
- Select the Manage Layers tab at the top of the Add/Manage Layer pane to display the list of all added layers.
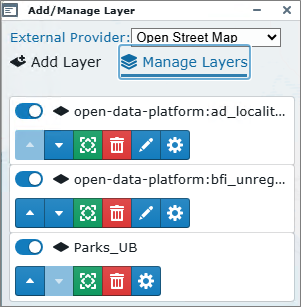
Fig: Add/Manage Added Layers - To switch OFF any of the added layers, move the toggle switch from right (
 ON) to left (
  OFF) for one or more layers.
 - When the toggle switch is set to OFF, the Layer is switched off on the Layers Pane.
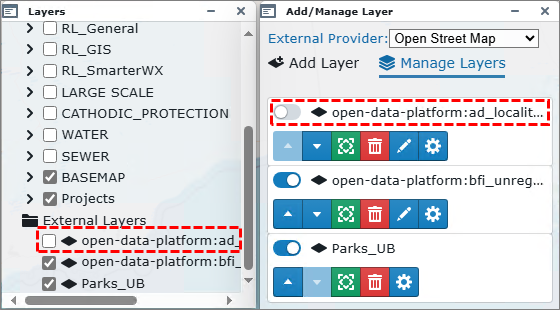
Fig: Layer is Switch Off - To permanently remove the added layer, select the Remove button
 .
. - The layer is removed from the Add/Manage Layers list as well as from the Layers Pane.
Layering Tools
 Layer Profiles
Layer Profiles allows users to select profiles to apply to the session where the selected profile determines which layers are switched on or off and which layer groups are expanded or collapsed by default when the user opens a new session of enlighten. Layer Profiles assist with setting the working environment to save time when navigating around the map, so the user selects a profile and then opens their enlighten session. To turn off these layers, select another User Layer profile or select Default to reset the map back to its default state.
When selecting the Layer Profiles tool ![]() from the enlighten toolbar, the User Layer Profiles pane will display a list of saved layer profiles. For the first session the Default private layer profile is applied. This Default profile can be changed by the user by changing which layers are displayed by default. Users can save different layer states by clicking on the New button and typing a name for this profile and then selecting Save.
from the enlighten toolbar, the User Layer Profiles pane will display a list of saved layer profiles. For the first session the Default private layer profile is applied. This Default profile can be changed by the user by changing which layers are displayed by default. Users can save different layer states by clicking on the New button and typing a name for this profile and then selecting Save.
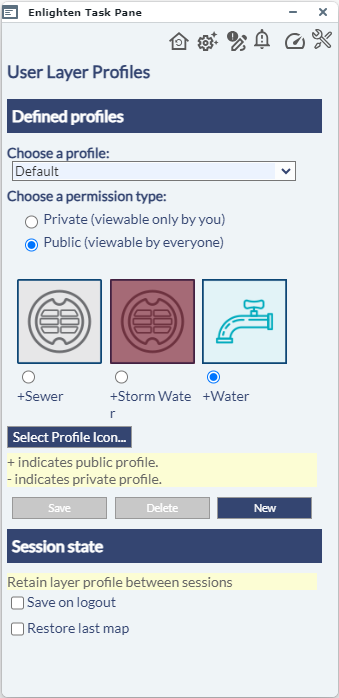
Fig: User Layer Profiles task pane
The Layer Profile task pane is divided into two sections where the Defined Profiles section allows the user to select existing layer profiles, create new layer profiles, or modify, save and delete Layer Profiles. The Session State section allows the user to determine how the layer profile is applied or retained between sessions. The profile permissions can be set to be Private (-) or Public (+) where Public means that all enlighten users can apply the Layer Profile, and Private means the profile is only viewable to the user.
Creating a New Layer Profile
Before creating a new Layer Profile, the user would first need to switch on/off the layers they want to view and set which layer groups are to be expanded by default. This is done by selecting the Layers List and Control Pane from the main toolbar and ticking the check-boxes next to the layers to switch on, and expanding the Layer Groups as required.
To create a new Layer Profile, complete the following steps:
- Using the Layers List and Control Pane on the Main toolbar, expand the required Layer Categories and turn on the required layers.
- Open the Layer Profiles tool from the enlighten toolbar.
- Select the New button and notice that the Choose a profile text box is cleared of all text.
- Type in the name of the new Layer Profile in the Choose a profile text box, i.e. Sewer Jax.
- Set whether the new Layer Profile is Private (-) or Public (+).
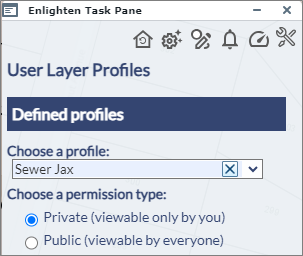
Fig: Creating a new Layer Profile - Select the Save button to save the Layer Profile.
- Follow the steps in the next topic to apply the Layer Profile Icon.
Changing Layer Profile Icon
A selected Layer Profile icon can be changed by users for their own private profile and by an administrator user for public profiles.
To change the Profile Icons do the following:
- Select the Layer Profile whose icon is to be changed, for example, select a Public or Private profile, then select the radio button below the Profile name.
- Select the Select Profile Icon... button on the User Layer Profile task pane.
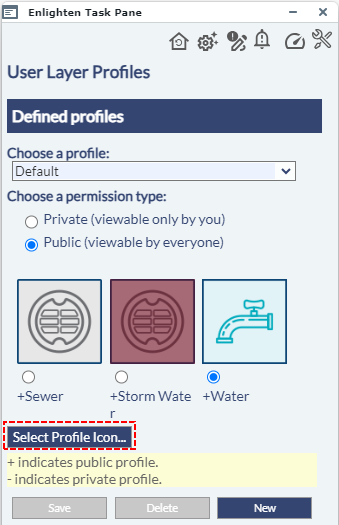
Fig: Change Profile Icon - The user is then directed to select an icon from the list of available icons by selecting the radio button below the image.
The required Layer Profile image files must be saved in the C:\websites\enlighten5\images\Profiles folder on the MapGuide server.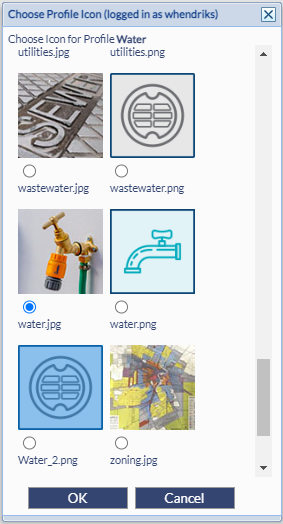
Fig: Select Profile Icon - Select the OK button to return to the Layer Profile task pane.
- On the Layer Profile task pane select the Save button to save the updated Profile icon.
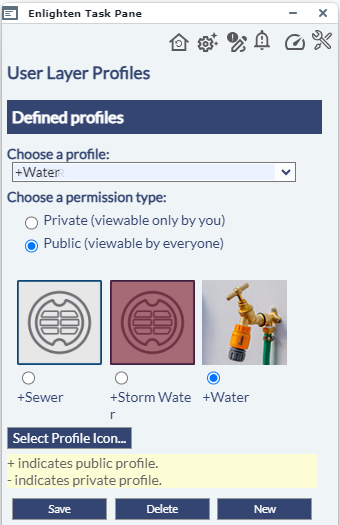
Fig: Save Profile Icon
Saving Layer Profile Session State
There are two options at the bottom of the User Layer Profiles task pane where the user can opt to save the selected Profile on logout, or to restore the last map on next login. Only one option is allowed to be selected.
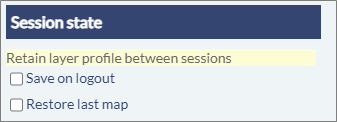
Fig: Save Session State
- By selecting the Save on Logout tick-box, the selected Profile will be applied when the user next logs in to enlighten, and the layers which are setup to display for the selected profile will be restored.
- By selecting the Restore last map tick-box restores on login whichever layers were displayed at the time the user last logged out.
Layer Profiles when using SSO
When users are configured to use Single Sign On (SSO) to open their enlighten sessions, they do not have the option to select a profile to apply when logging onto enlighten via the enlighten Home page. However, once they have opened their enlighten session, the user has the option to change their Layer Profile by selecting the Layer Profile icon ![]() on the Enlighten Toolbar and selecting the profile they wish to apply. As part of the Set User Options, the Layer Profile can then be saved on logout and will be applied for their next enlighten session. See Manage User Options for more details on how to save the Layer Profile.
on the Enlighten Toolbar and selecting the profile they wish to apply. As part of the Set User Options, the Layer Profile can then be saved on logout and will be applied for their next enlighten session. See Manage User Options for more details on how to save the Layer Profile.
Easily Clear input fields on a Mobile Device
When users access Enlighten from a mobile device, it can become difficult to input and clear the input on text fields. As a solution to this, a distinct close "X" button was added to allow the user to clear input by pushing one button, as opposed to hitting backspace multiple times.
This feature also makes it easier for the desktop user to quickly remove information from the input field, saving time and increasing efficiency.
The example below references User Layer Profile, where on the mobile device display the X button is available for the user to clear the profile field.
![]()
Fig: Clear selection for Layer Profiles
 Layer Filter
The Layer Filter tool ![]() found on the Advanced Toolbar, applies pre-defined SQL criteria to display only entities within a layer that match the criteria selected. Please note that the layer needs to be within its visible scale range to apply the filter. Layer Filters are set up and saved to the database by the Administrator in Map Administration. See the Enlighten Administrator's Guide for more information.
found on the Advanced Toolbar, applies pre-defined SQL criteria to display only entities within a layer that match the criteria selected. Please note that the layer needs to be within its visible scale range to apply the filter. Layer Filters are set up and saved to the database by the Administrator in Map Administration. See the Enlighten Administrator's Guide for more information.
- To use layer filter, turn on the layer to be filtered and click on the Layer Filter icon.
- A working pane will open in the right-hand side of the screen.
- In this pane, you will be able to select a filter from a drop-down list (configured by the administrator).
- In the example below Water Pipes by Material is selected. The name of the filter is Water Pipes by Material, and the filter is setup to filter on all pipes that contain Polyvinyl Chloride material.
- Select one of the available filters and type in or choose the required value as shown in the example below.
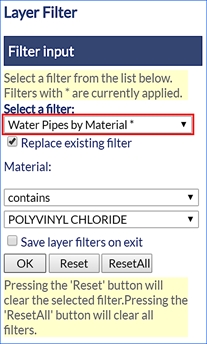
Fig: Selected Layer Filter Represented by an Asterisk
After clicking on OK, all the registered pipes that are of Polyvinyl Chloride Material will only be displayed hence removing pipes of other materials from the map temporarily. To clear a filter selection hit the reset button. The reset button is only active when the working filter is selected.
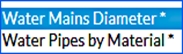
Fig: Multiple Filters Active
The example above uses Water Mains Diameter and Water Pipes by Material which are layers based on the SP_WATPIPE spatial table. The user can see which filters are active by the asterisk next to the name.
If the user applies Filter A (Water Mains Diameter) on a specific layer, the results will be returned accordingly. Thereafter if the user applies a second Filter B (Water Pipes by Material), the results returned will consider both Filter conditions.
An example of this is when the user applies a Filter on the Water Mains Diameter where the Diameter is = 100mm, thereafter places another Filter on Water Pipes by Material where Material Type = Polyvinyl Chloride Material. The results that will be returned after the second filter, will show all Pipes with a Diameter of 100m but which are of Polyvinyl Chloride Material.
Replace existing filter. This functionality takes into consideration the above-mentioned dual filter which is applied and ensures that the first filter condition is cleared / ignored when running the second filter.
To Reset both filters, the user can refer to the Reset All button, which would then return all records of a specific layer, removing all filters from the map.
Save layer filters on exit is a function which ensures the logged in user, retains the layer filters upon logout. If the layer filters are intended only for the current session, then the logged in user should ensure that this checkbox is not ticked.
The filtered objects can be selected and saved and/or their attributes exported via Show Info.
 Theme Layer
Using the Theme Layer tool
![]() on the Advanced Toolbar, users can create a new temporary layer which is displayed in the Layer Control pane which applies user defined stylization of features based on the object properties or data associated with the object. The Themed Layer can only be based on an existing layer authored in the map.
on the Advanced Toolbar, users can create a new temporary layer which is displayed in the Layer Control pane which applies user defined stylization of features based on the object properties or data associated with the object. The Themed Layer can only be based on an existing layer authored in the map.
To create a Themed Layer complete the following steps:
- Select the Theme Layer icon on the Advanced Toolbar to open the Theme Layer pane.
- Select an existing Layer from the drop-down list on which the theme is to be applied, for example Parcels.
- Enter a descriptive Theme Name which is displayed as the Layer Name in the Layer pane, for example Parcel Area.
- In the Define Conditions section, select a Property from the drop-down list to use as the basis of the theme, for example GEOM_AREA.
- The Minimum and Maximum values are auto-populated based on the values in the database and can be edited to refine the theme.
- Select the required Distribution from the drop-down list, for example Standard Deviation.
- Enter the number of ranges to be created as the Number of Rules.
- Select the Scale Range at which the layer is to be displayed.
- Enter the Fill Transparency percentage where 0% is not transparent and 100% is fully transparent.
- Select the Fill Colors and Border Colors to apply to the theme range.
- Once all the theme conditions have been set, select the Apply button to create the temporary themed layer.
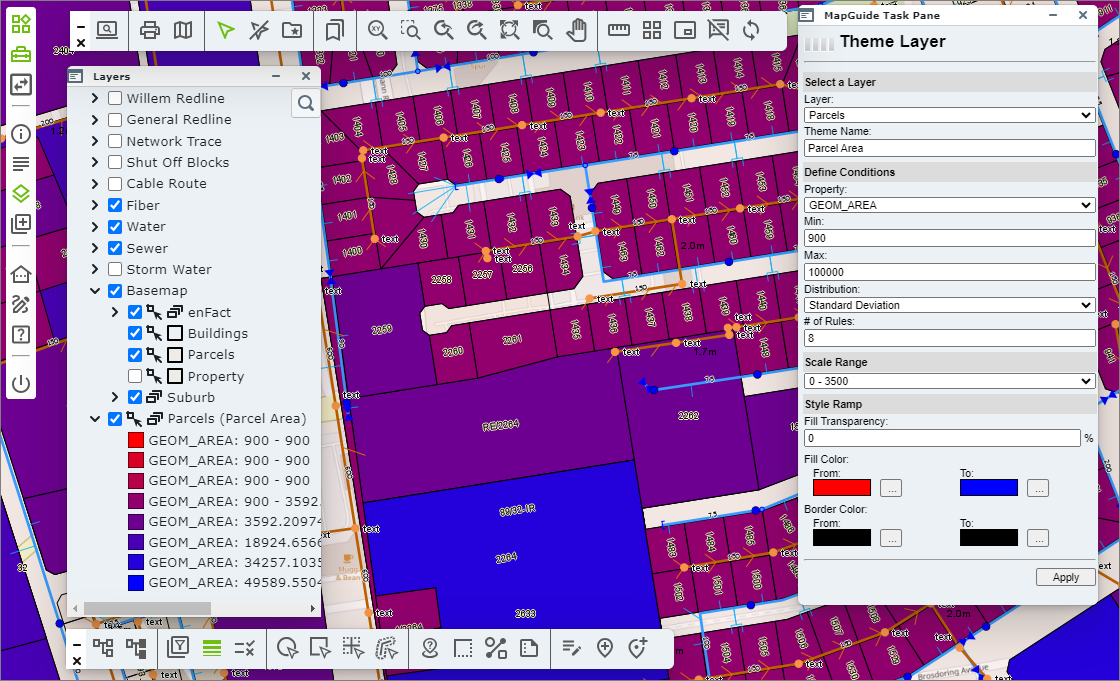
Fig: Themed Layer configuration and results
Common Tools
 Search Pane
When the search icon ![]() is selected, the Search pane is loaded where the first Search Group is displayed by default. If the administrator makes changes to the Search Group order, the order of Searches will change accordingly. The searches available within the Search Groups drop-down lists are configured by the GIS administrator and are assigned to specific users. The layer on which the features are authored must be visible at the time the search is run, else no results can be displayed.
is selected, the Search pane is loaded where the first Search Group is displayed by default. If the administrator makes changes to the Search Group order, the order of Searches will change accordingly. The searches available within the Search Groups drop-down lists are configured by the GIS administrator and are assigned to specific users. The layer on which the features are authored must be visible at the time the search is run, else no results can be displayed.
The Search criteria is configured by the the GIS administrator, and the columns and headers displayed in the Search Results window are configured and ordered when the search is created. The GIS administrator can also setup the maximum number of records to auto-zoom to when the search is run. As part of the Search configuration, the attributes for the features returned in the results can be viewed in the Show Info pane if a Show Info form has been defined.
Depending on the how the GIS Administrator has configured the setting for the maximum number of objects for direct zooming after running search, if the search results do not exceed this number and the setting is active, the map is zoomed to the extents of the features matching the search criteria. If the search results return with only one record, the map is automatically zoomed to the screen centre where the object is selected and the associated attributes displayed in the Show Info pane. If no Show Info form has been setup for the feature, the Show Info pane is opened and a warning message is displayed indicating No Form Defined.
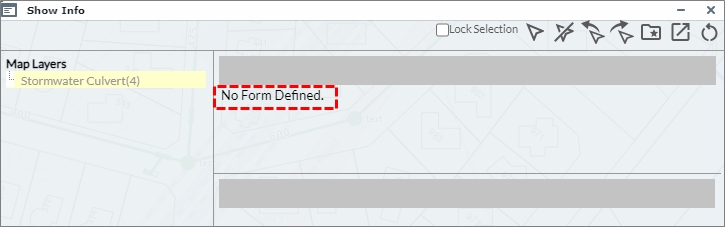
Fig: Warning message for No Form Defined
If the search is configured to use a Show Info form, the results of the search will be displayed on the Show Info pane. If no Show Info form is configured for the search, then the search results will display in a separate Search Results window which has a link to display the search results in the Show Info pane.
The search example below is a Water Pipes search where the pipe diameters are captured as being 700mm. To perform a search showing Water Pipes, you would do the following:
- Ensure the Water Pipes layer is displayed on the map.
- Select the search Water Pipes from the list of searches available in the drop-down list.
- Enter the additional search criteria, in this case all Pipes with a Diameter equal to 700 will be searched.
- Select the Search button.
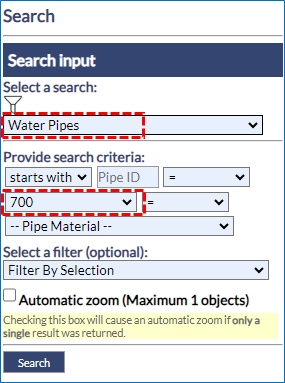
Fig: Search Menu Side Pane - The resultant search displays a list of Water Pipes, which match the search criteria, in the Search Results dialog box. In this example a total of 19 Water Pipes match the search criteria.
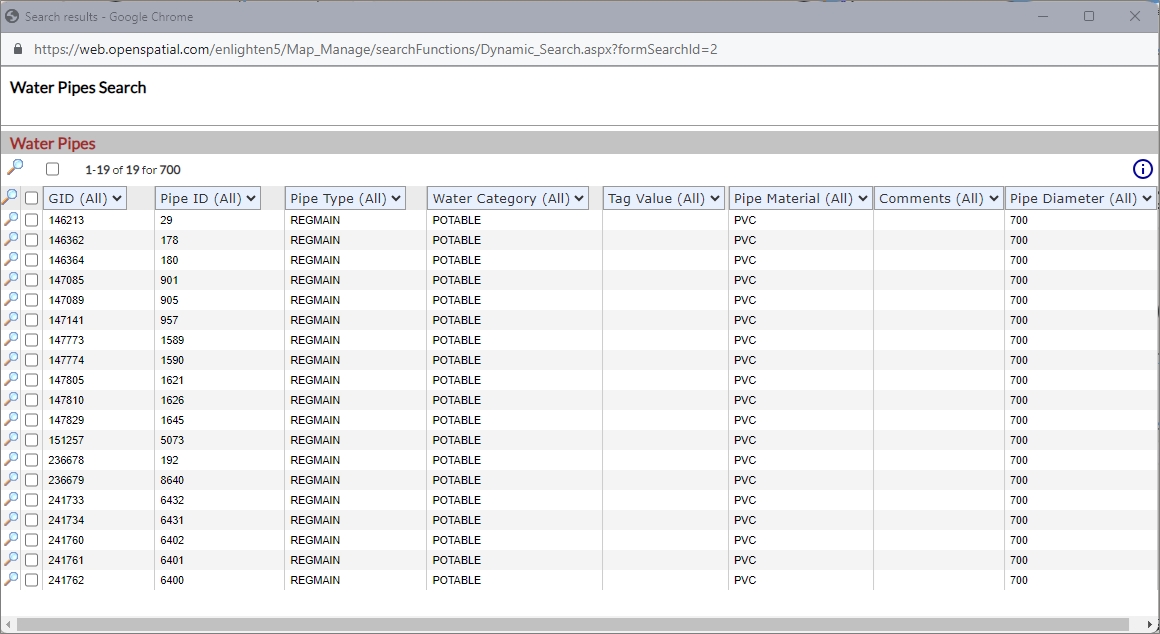
Fig: Search Results Dialog Box for Water Pipes with 700 Pipe Diameter - If a selection set has already been saved, this can be added to the search criteria from the Select a filter drop-down menu and the chosen selection set used to further filter the search results. See selections.
In the example below, the filter Randpark Water has been added to the search criteria, and in the Search Results dialog box, the number of pipes returned has reduced to 5 pipes.
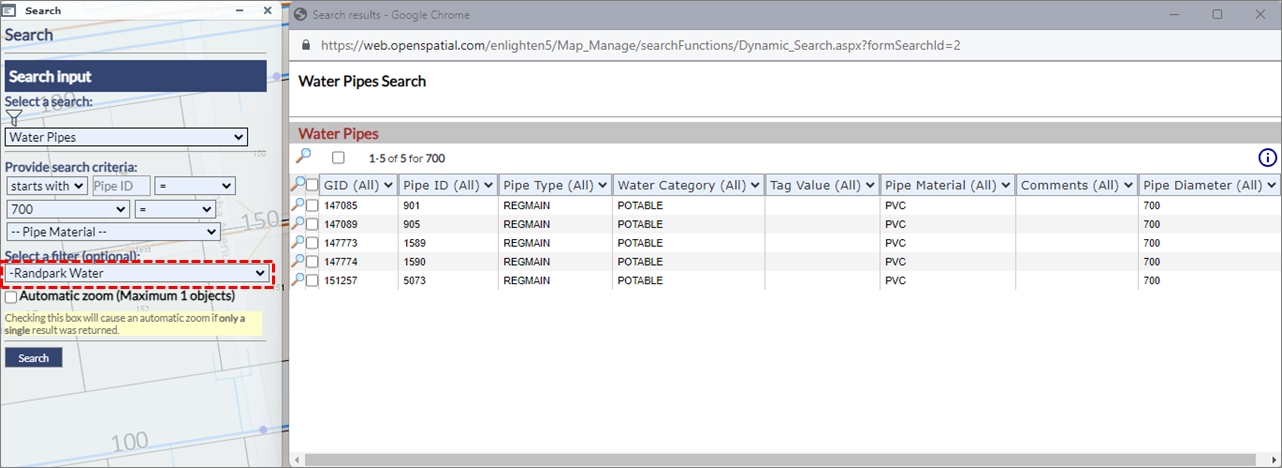
Fig: Search Results Dialog Box applying a saved selection set as an additional search criteria filter - Once a search is completed the search results window will open displaying the search criteria as information.
- When the top magnifying glass is selected, you will zoom to the extent of all items shown in the search results.
- The second magnifying glass on the grey bar will zoom to all checked items that have the box ticked next to them in the list.
- The magnifying glasses in the list view will take you to the single object on the map represented in the adjacent record.
Fig: Zoom options in Search Results - Zoom to all results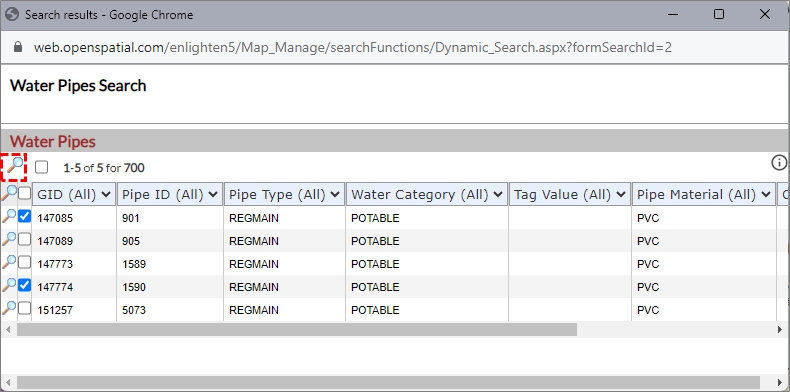
Fig: Zoom options in Search Results - Zoom to checked objects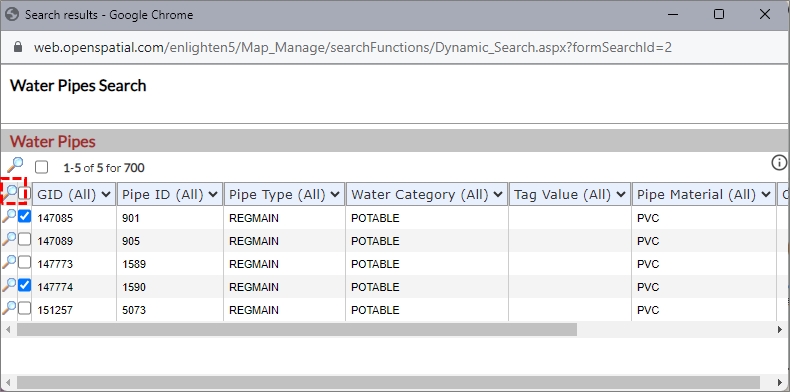
- The Search Results can be filtered using the column header drop-down boxes.
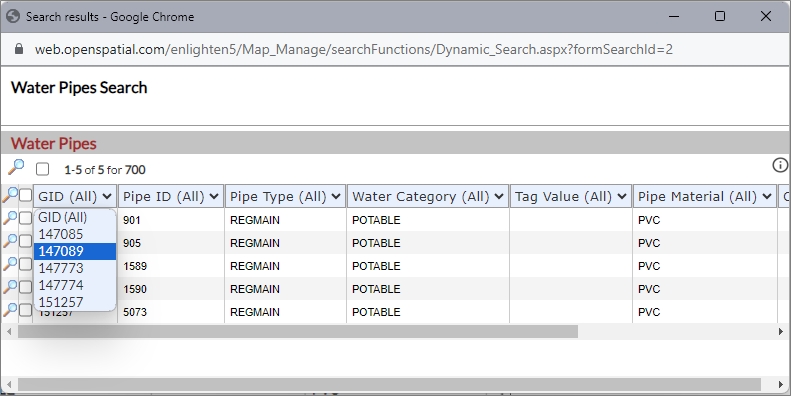
Fig: Filter Search Results on values below Column Headers - The Search Results dialog box can also be used to invoke Show Info forms simply select one or more objects from the table and click the Show Info icon
 in the top right-hand corner of the dialog box.
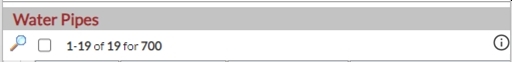
Fig: Invoke Show Info from the search results list - The search can also be limited to the selection currently active in the map by selecting Current Map Selection in the Filter By Selection drop-down menu. The search can also be filtered by applying a previously saved search, for example Randpark Water.
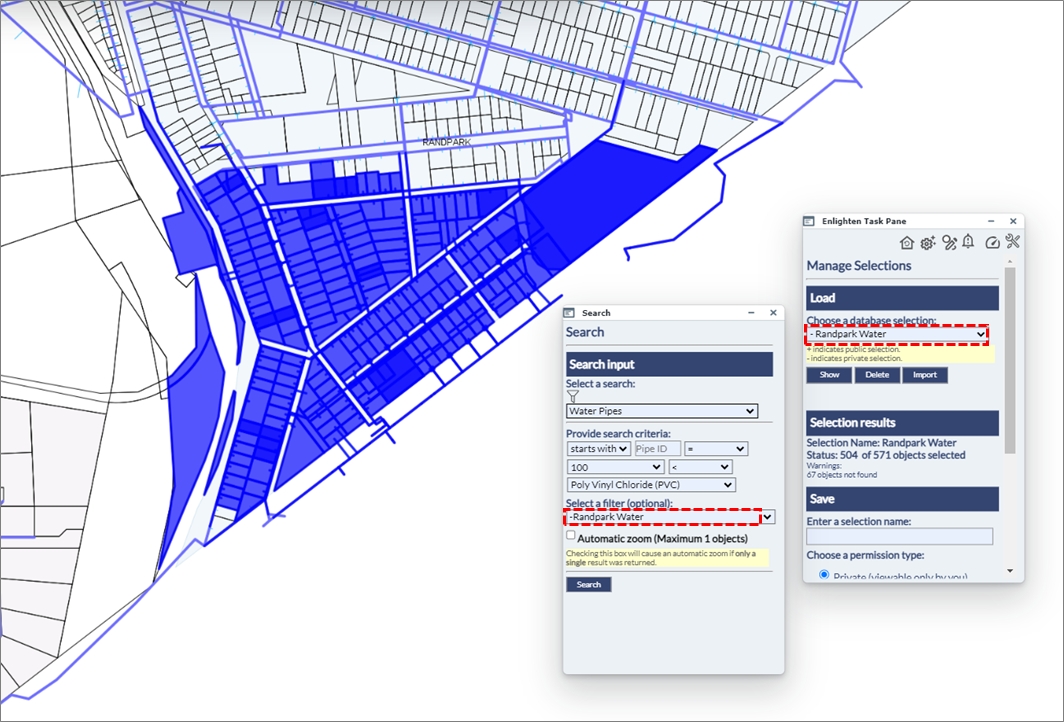
Fig: Search using Current Map Selection
Point Object Searches
When doing a search on Point Objects and a single result is returned, the map is automatically zoomed the the extents of the object while also applying a buffer distance. The zoom buffer setting POINT_ZOOM_BUFFER can be increased or decreased by the enlighten Administrator, or by a user with admin privileges.
- In the example below, a search was completed for a single Water Node (GID = 143725) and the POINT_ZOOM_BUFFER was set to 20m. When the Search button was selected, the map was zoomed to the resultant node and the Show Info pane was automatically opened with the attributes displayed for the selected water node object.
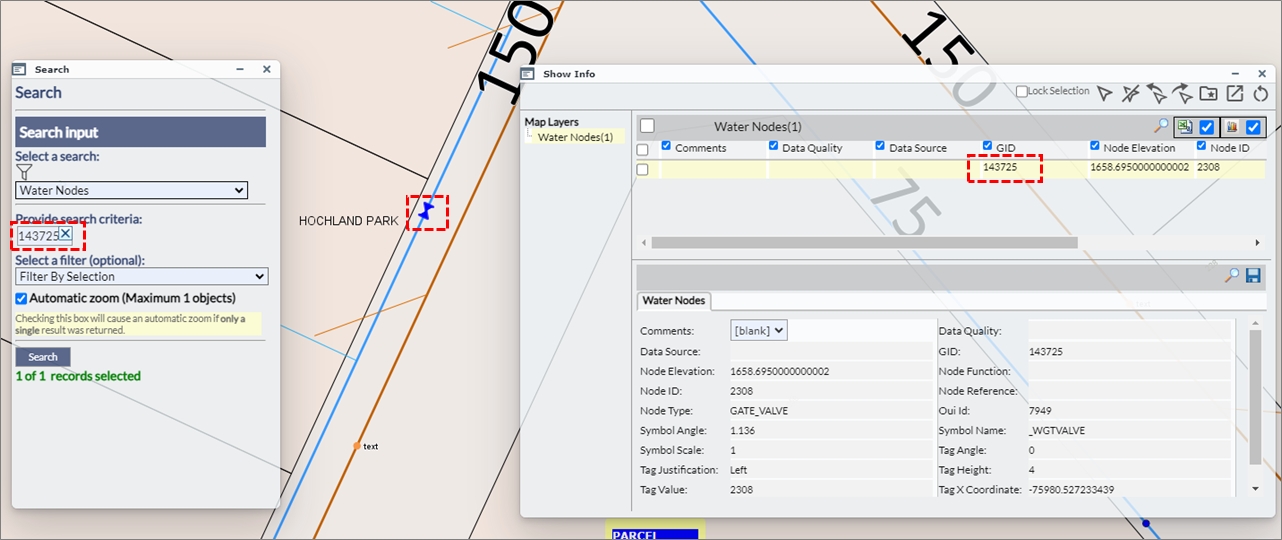
Fig: Point Search Buffer with buffer distance of 20m - In the second example below, the same search was completed for the same Water Node, however the POINT_ZOOM_BUFFER was set to 100m.
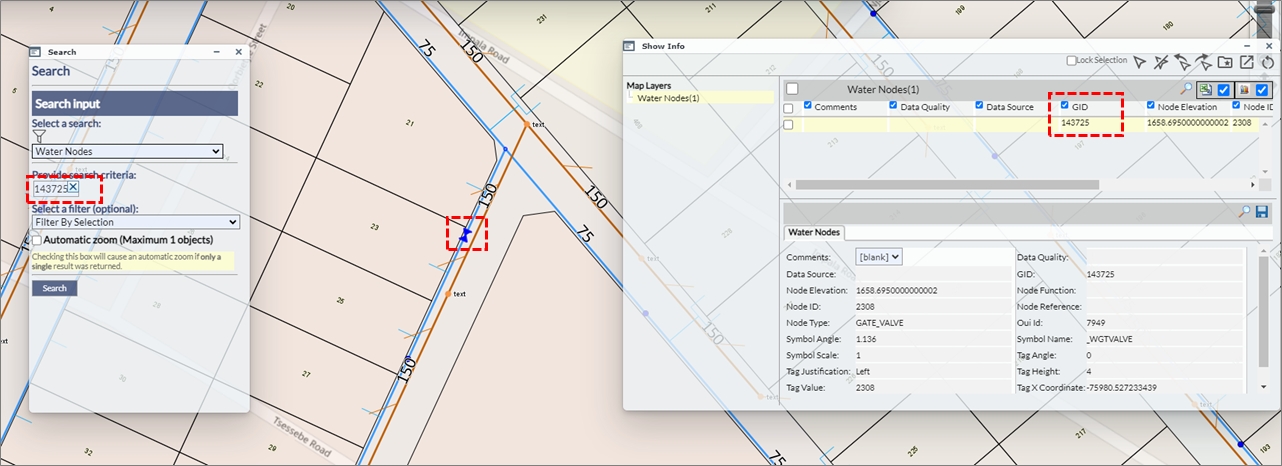
Fig: Point Search Buffer with buffer distance of 100m
Assigning Searches to Users
enlighten provides the option of assigning customized search types to specific users. This is because, in most instances, not all departments want or have the need to access the entire list of search types. Please contact your enlighten Administrator if a specific search is required.
Dynamic Filtering on Searches
When a user initiates the Search function the user can apply the Dynamic Filter to limit the number of searches displayed in the drop-down box based on matching criteria entered in the filter text box. The aim of this tool was to create an ease of convenience experience for the user, as in some organizations there could be multiple searches configured. This would make it difficult scrolling down the list, through each search and selecting the relevant one, hence the convenience of the Dynamic Filter. This then allows the user to easily filter for the search titles of relevance, saving time and effort.
To activate the Dynamic Filter option:
- Click on the Filter icon, next to the Select a search drop-down menu.
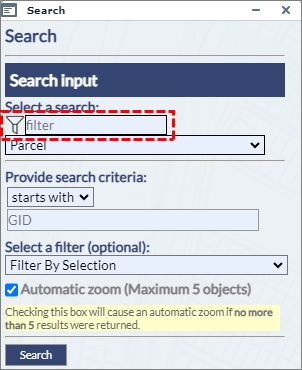
Fig: Dynamic Filter - A new text box input item will become available upon clicking the Dynamic Filter icon. This enables the user to easily type in a keyword of a search title, and the system will automatically filter all searches containing the specified keyword.
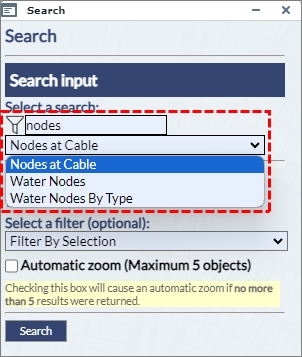
Fig: Dynamic Search Filter Results - If the user then clicks on the drop-down menu of the select a search item, then the user can easily see that only searches containing the keyword address have been filtered out in the select a search drop-down.
- After selecting the relevant search the user can once again click on the Dynamic Filter icon, which would then change to black in colour. This change in colour (or a fill) indicates to the user that the Dynamic Filter is now active.
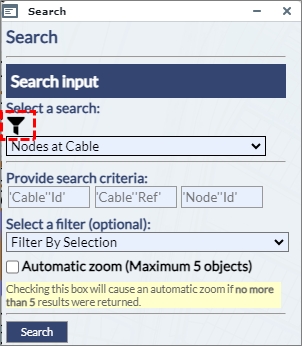
Fig: Dynamic Filter Active - Hence this Dynamic Filter tool helps the user to filter through the necessary searches, thereafter to type in a keyword for a list of searches. Once done apply the dynamic filter condition and then navigate between a short-listed set of searches, which the dynamic filter retains. This saves time and allows for a more user-friendly experience.
Common Key Searches
A Common Key Search allows a search to find results across multiple components . A Component is an additional set of spatial and attribute data that can be added to a search. When a component is added to a search that shares the same key (column) a common key search can be created. For example, Sewer and Water Service Connections (SP_WATSERV and SP_SEWSERV) can be linked to Land Parcels (SP_PARCEL), where PRCL_GID in the service connections tables match the Parcel GID value.
A common key search will query information from the search and search components. Allowing users to enter for example GID values that may belong to several tables and return results.When a common key search has been configured in the administrator's environment, the user can enter comma separated lists in the search field in the user environment.
- The example below shows a Common Key Search on Parcels linked to Water and Sewer Service Connections.
- The user enters a string of GID values into the Search Criteria separated by a comma, i.e. 47817,160104,84950,11921,84952,160103,24403,47814. There must not be any spaces between the values and the comma separators.
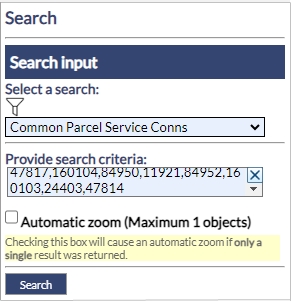
Fig: Common Key Search Criteria - The results of the search detail in which component (Spatial or Attribute Table) the entered GID values were found.
The results also display Warnings where the entered GID values were not found in each of the components.
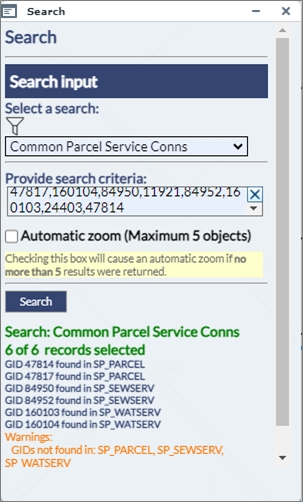
Fig: Common Key Search Results - When multiple records are matched, the Basic Info pane can be opened to display the the attributes of the matched spatial objects. In the example below, the user can select the Spatial Table from the drop down list as well as the matched record, and then use the Zoom to this Feature button
 to zoom to the selected object on the map. The featured returned in the search are highlighted in blue on the map.
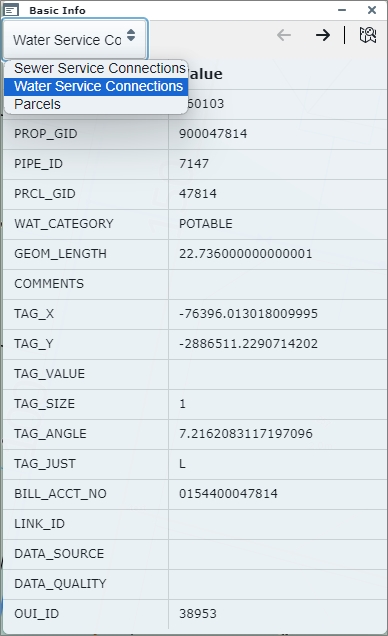
Fig: Properties Pane displaying results of matched records from Common Key Search - As the user pages through the various features returned in the search, the feature in focus on the Basic Info pane is also highlighted on the map in red.
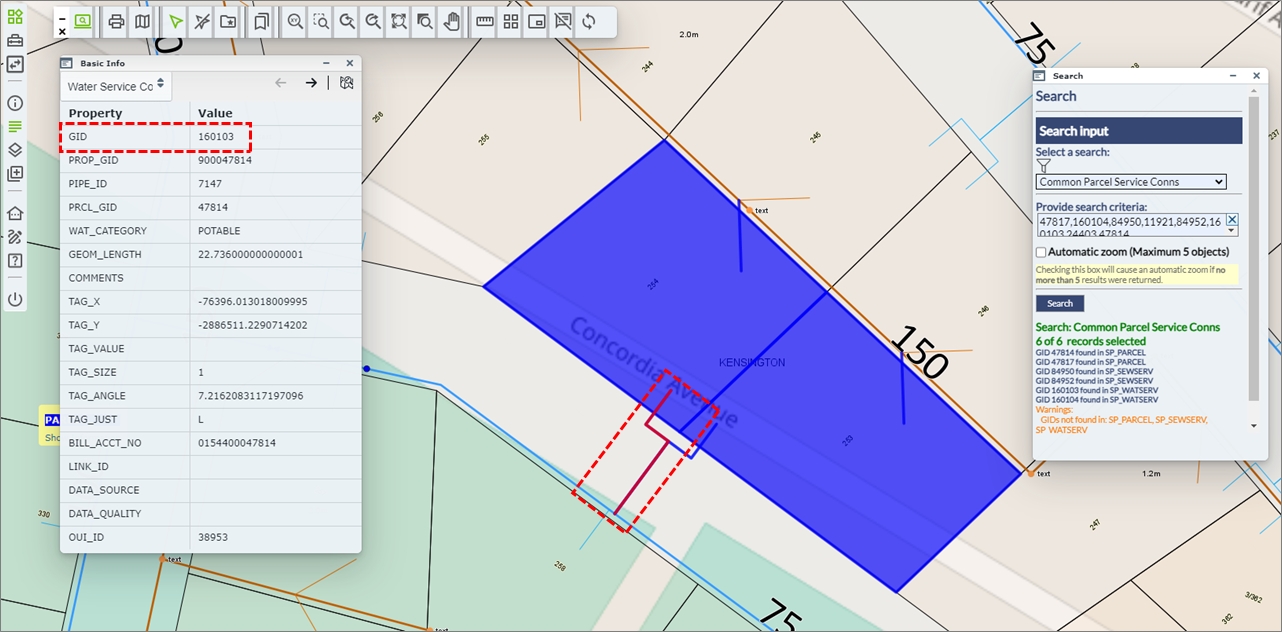
Fig: Feature in focus on Basic Info pane is highlighted on the map
Searches with spaces are converted into Commas
In the search criteria where there are spaces, this will be treated as a comma and the search output will display it in the appropriate manner. This means that the user can search for specific results containing values which are specified in the search criteria.
- The example below is setup based on Address Parcel, essentially searching on the street numbers, which are either 1 2,32,50 and 65.
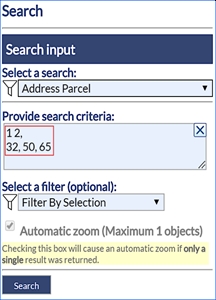
Fig: Spaces in Search Criteria - Once this is searched, the user can click on the Search button and the following output will be generated:
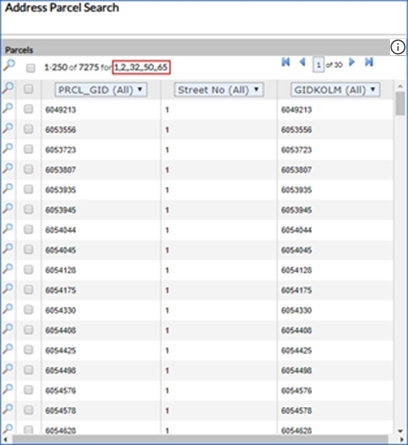
Fig: Spaces in Search Criteria converted into Commas
Clearing Search input fields
When users access enlighten from within a mobile device, then it becomes difficult to input and clear the input on text fields. As a solution to this, a distinct X button was added to allow the user to clear input by pushing one button, as opposed to hitting backspace multiple times.
This feature also makes it easier for the desktop user to quickly remove information from the input field, saving time and increasing efficiency.
- The example below references Searches, and the X button is available for the user to clear the search criteria field for the search called Address Parcel.
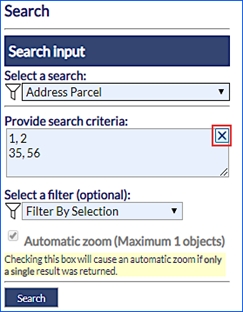
Fig: Clear selection in Searches
Search pane displays number of records returned
When the user activates a search, if the number of records returned in the search does not exceed the maximum number defined by the Administrator, and if the automatic zoom checkbox is selected, then enlighten will automatically zoom to the searched record/s.
However, if the user activates a search which yields multiple records exceeding the number defined for the automatic zoom , the search results dialog will pop up with a list of matches according to the search criteria. If the user selects multiple records from the search results dialog, then the number of records being searched will also be displayed on the task pane. The maximum number of records automatically zoomed to is set by the Administrator in the configuration setting called MAX_DIRECT_ZOOM_CNT, and the zoom buffer is set in the configuration setting called POINT_ZOOM_BUFFER.
An example of a search automatically zooming to the results can be seen below:
- The Search pane was set to use the search titled Parcel Tag Value.
- The Search criteria was set to search for all portions of the parcel tag value containing the text string "/126".
- The check box for Automatic Zoom is ticked for a maximum of 6 records.
- The results of the search yields 2 records and they are automatically zoomed to screen center, and the Show Info pane is automatically opened to display the attributes for the search results.
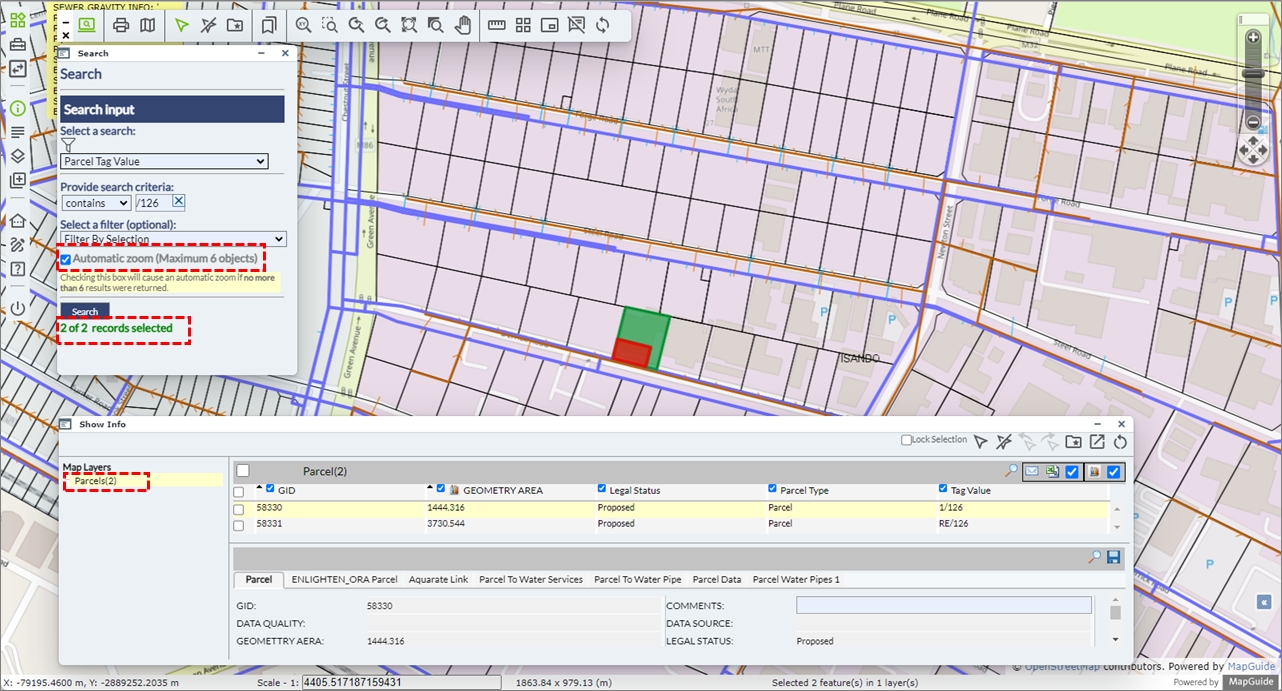
Fig: Number of Search Records selected
 enPlot Plot Engine
The new plotting engine and plot application deliver:
- High-quality plotting.
- Printing to scale.
- Printing on A0 through to A4 paper
- Generates PDF output from within enlighten and third-party applications
All external layers added during the enlighten session are temporary and are removed from the Layers pane once the enlighten session is closed. These external layers, including WMS/WFS Layers, are not available for inclusion when generating plots using the enPlot Plot Engine function ![]() , nor are the Layers available for inclusion in the QuickPlot function
, nor are the Layers available for inclusion in the QuickPlot function ![]() , both of which are available on the enlighten Toolbar.
, both of which are available on the enlighten Toolbar.
Functions are configured by your enlighten administrator. Not all functions below may be available to you.
- Make a selection of one or more objects in the map.
- To access enPlot select the enPlot tool on the enlighten toolbar. This will open a side pane that will display all the plots that have been configured. Groups will be displayed with the option to expand them. Underneath the groups, all the plots that have been defined for you will be visible.
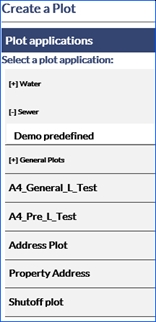
Fig: enPlot Side Pane - Once you select a plot application from the list an enPlot dialog box will appear. Plot options are dependent on configuration. Plots may be:
- Pre-defined Plot: A Pre-Defined plot contains more information, which is pulled from the database.
- General Plot: A General plot is usually a simple interface.
Note: There is a known issue with plotting of redline objects on Pre-Defined plots.
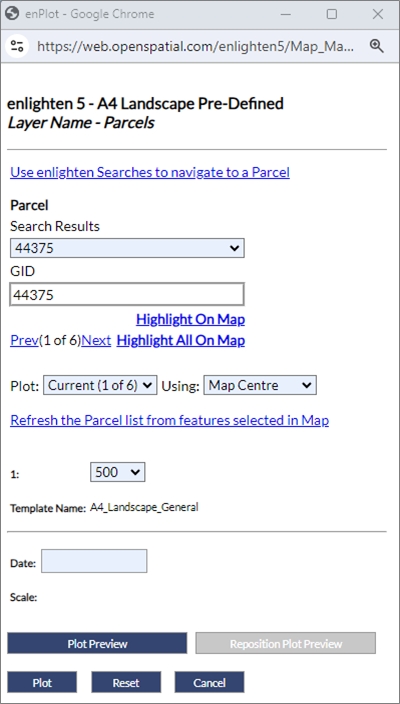
Fig: Pre-Defined Plot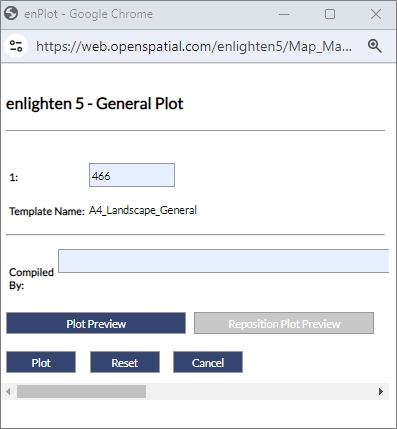
Fig: General Plot - If for the pre-defined plots, more than one map object was selected, the Search Results drop-down list allows the user to highlight one of the selected objects to plot.
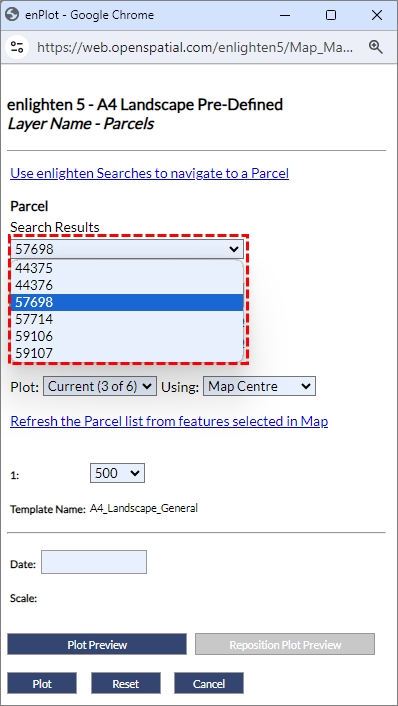
Fig: Search Results drop-down list of selected objects - The functionalities that can be configured vary between General and Pre-Defined plots. All available options are included below:
- Auto Scale: Auto scale uses a value that is pre-defined by your administrator when selected.

Fig: Auto Scale in Plot Application - Scale: The scale is initially taken from the map and displayed in the text field. This field can be configured by entering free text.
Fig: Scale in Plot Application - Page Orientation: The page orientation can be toggled between landscape and portrait in the drop-down list.
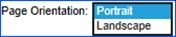
Fig: Page Orientation Plot Application - Template name: More than one template can be assigned to a plot. If this is the case you will be given a drop-down list containing plot templates. If this has not been set, you will be able to see the single template the plot is based on.
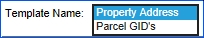
Fig: Template Name Plot Application - Use enlighten searches to navigate to a ‘configured search’: If a search has been configured for a plot you will have this option available. This link will open the ‘Search’ pane, where you can locate and zoom to specific features. Once your feature is selected on the map you can refresh the plot information by selecting Refresh the configured Search list from features selected in the map.
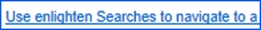
Fig: Use enlighten Searches to Navigate to a 'Configured Search' Plot Application - Refresh the ‘configured search’ list from features selected in the map: If the configured search is refreshed based on features selected on the map, the configured search dialog box list will be updated.

Fig: Refresh Features Selected on the Map Plot Application - Search Results: The search results displayed are dependent on the search configured for the plot and will vary. When a feature is selected on the map the results will automatically populate the fields defined.
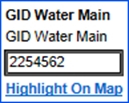
Fig: Results for Selected FeatureNote: When no items are selected on the map you will see the following message.

Fig: Message Received when no Objects are Selected in Plot Application - Highlight on Map: Highlight on the map will select and zoom to the single feature whose details are shown in the search field.
- Highlight All on Map: Highlight all on the map will select and zoom to all features selected in the plot preview.
- Plot:
- Current: Will provide a single plot PDF.
- All: Will provide a plot PDF for each unit selected on the map.
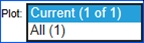
Fig: Plot Options Plot Application
- Using:
- Map Centre: All that is selected on the map will be highlighted in the plot or plots.
- Feature Centre: Only the feature whose information is shown in the search boxes will be displayed in the plot. When you plot all with feature centre each plot shows a different feature. When Feature centre is chosen plot preview is disabled.
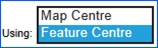
Fig: Using Options Plot Application
- Batch Plot: When a combination is used setting plot to All and using to Feature Centre as below you can do batch plotting.
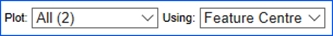
Fig: Settings for Batch Plot- A batch plot will create a number of plots specified by the number of features selected and create a separate plot PDF highlighting each separate feature.
- Include non-search related selections: When ticked this function includes non-search related selections to the generated plot. This is exclusive to pre-defined plots and unavailable for use within general plots.
Fig: Non-search related selection option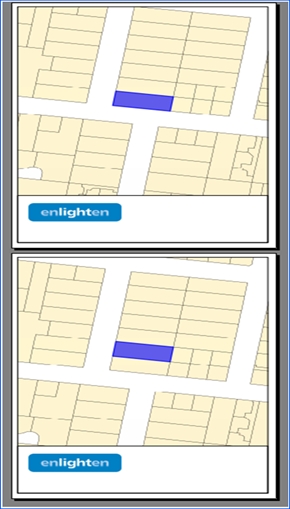
Fig: Batch Plot for Parcels SelectedNote: The user now has the ability to change/customize the selection colour on the plot engine results, which offers a more user-friendly output. This can be customized in the Manage User Options pane and change the current selection colour to a desired colour. - Text Fields: Text fields are often configured for headings to be displayed on the plot. They will vary in names but will be available above the plot preview section. These fields are entered as free text.
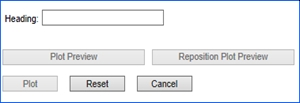
Fig: Text Field Plot Application - Plot Preview: The area of the map that will be plotted can be previewed and modified by selecting the Plot Preview. The Plot Preview will display a red box at the centre of the map to indicate the area that will be plotted. The plot preview options are not available when you select to plot by feature centre.
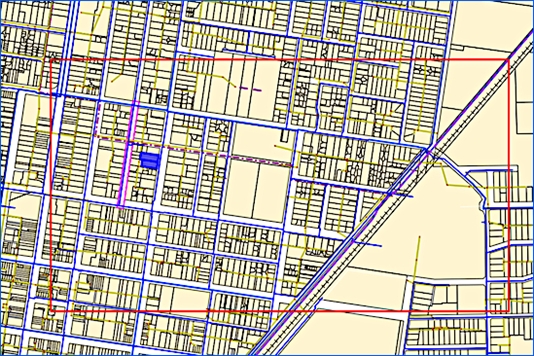
Fig: Plot Preview - Reposition Plot Preview: To move the plot area, select the Reposition Plot Preview option. The focus changes to the map window and the cursor becomes a marker. Click where the centre of the new plot area should be, the previous plot area location will be outlined by a green box.
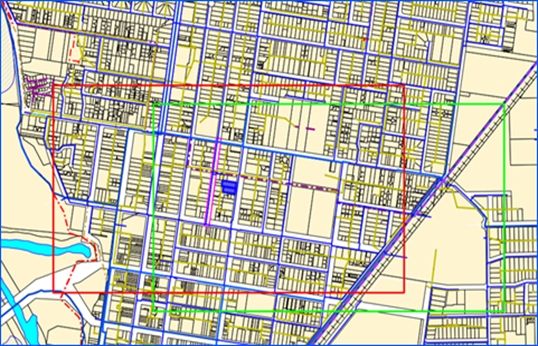
Fig: Reposition Plot Preview - Plot: On selecting Plot the window shown below will appear.
Fig: Plotting Applications Status Window
This window confirms that the plot is in progress. Once finished, a PDF will be returned. The time required for the plot to return is depending on the number of layers, scale and number of pages for which the plotting will occur.Note: On Android tablets, Chrome is the suggested browser. The user should ensure a PDF viewer is installed on the device. Once plotting is done, the .pdf will be downloaded and can then be opened. The plotting applications status window will continue processing however this superfluous window can be closed. 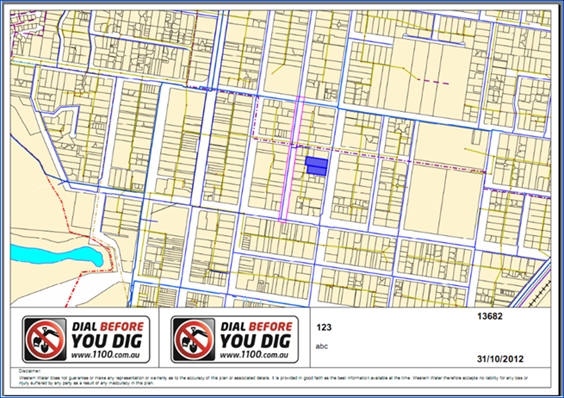
Fig: Output PDF from General PlottingNote: Selected objects within the map view will appear differently in the plot output. The selection style is configurable by the administrator. - Email: An option to send plots to an email address can be configured by your Open Spatial consultant. If this is configured when you select the Plot button an email will be sent automatically.
- Reset: The Reset button will remove any information that has been entered in the plot application dialog box and restore defaults.
- Cancel: The Reset If you click Cancel the plot application dialog box will be closed.
- Auto Scale: Auto scale uses a value that is pre-defined by your administrator when selected.
Layer Filter available for Plots
When a layer filter is active, then within the plot window a check box will be displayed, prompting the user to decide if the active filter should be applied to the plot. This means that the plot will be generated based on the filter results which is active in the layer filter tool.
Layer Filtering is available for both general and pre-defined plots.
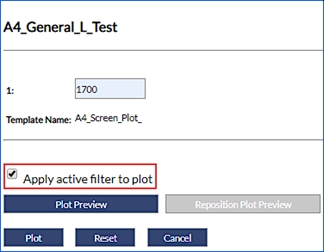
Fig: Layer Filter optional for General Plots
 QuickPlot
QuickPlot is a component of MapGuide Open Source which allows users to generate a quick plot of a map and publish to PDF. Within the Quick Plot tools users can select the page size, orientation, scale and determine if the map legend, scale bar, north arrow etc. is to be displayed on the map. By default the Quick Plot uses the current screen map orientation and applies a default paper size determined by the UNIT defined in the Map Projection setup for the enlighten base map.
The enlighten user simply enters the Plot Title and Sub-Title text, selects the Paper Size and Orientation, and checks the tick-boxes next to the Elements to include in the plot. Selecting the Advanced Options allows the user to alter the Scale, DPI and Rotation.
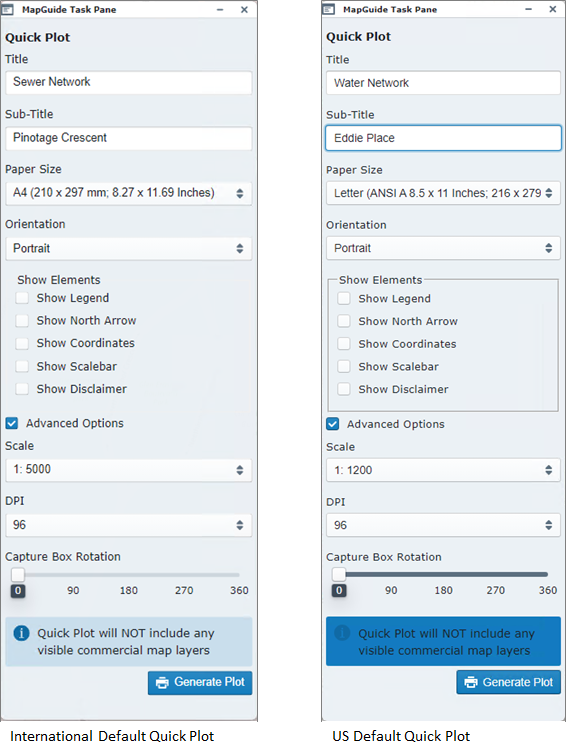
Fig: Quick Plot task panes for International and US Map Units
The different Quick Plot paper sizes are pre-configured and can be selected from the drop-down list which is determined by the UNIT defined in the Map Projection setup for the enlighten base map. If the UNIT parameter in Projection definition is set to Feet, the Page Sizes are displayed in Inches (in), and conversely, if the UNIT parameter in Projection definition is set to Meters, the Page Sizes are displayed Millimeters (mm).
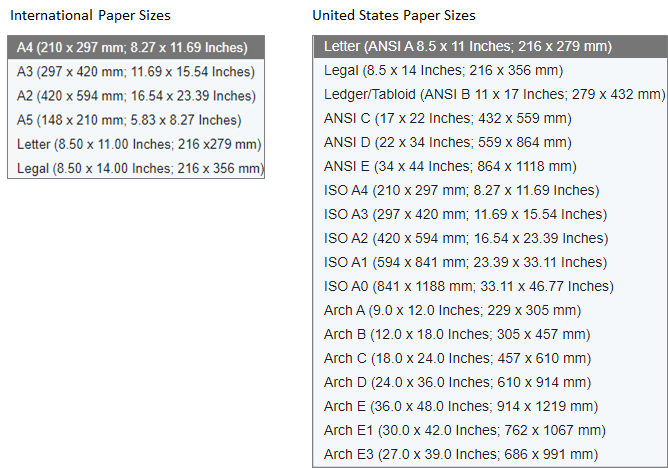
Fig: Quick Plot pre-configured Paper Sizes for mm and inches
All external layers added during the enlighten session are temporary and are removed from the Layers pane once the enlighten session is closed. These external layers, including WMS/WFS Layers, are not available for inclusion when generating plots using the QuickPlot function ![]() available on the enlighten Toolbar.
available on the enlighten Toolbar.
QuickPlot has Advanced Options allowing the user to set the map scale, DPI and orientation. When selected, a message is displayed indicating the current default Page Size and Scale applied.
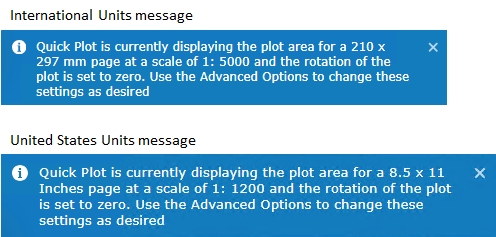
Fig: Quick Plot Advanced Options Messages
Changing any of the Advanced Option settings dynamically updates the Capture Box outline on the map displaying the extents of the area included in the plot.
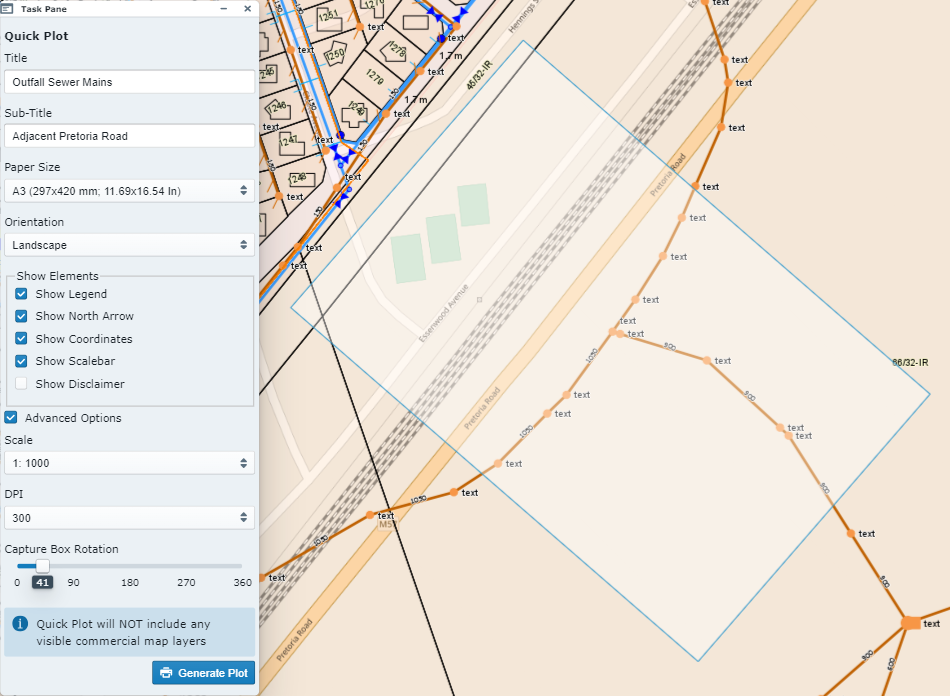
Fig: Quick Plot Advanced Options
The QuickPlot generates a PHP file which is opened in a separate browser window and applies the options selected in terms of Legend, North Arrow, Coordinates, Scalebar etc. When downloaded the QuickPlot is saved as a PDF file to a folder of your choice, and viewed using your default PDF viewer.
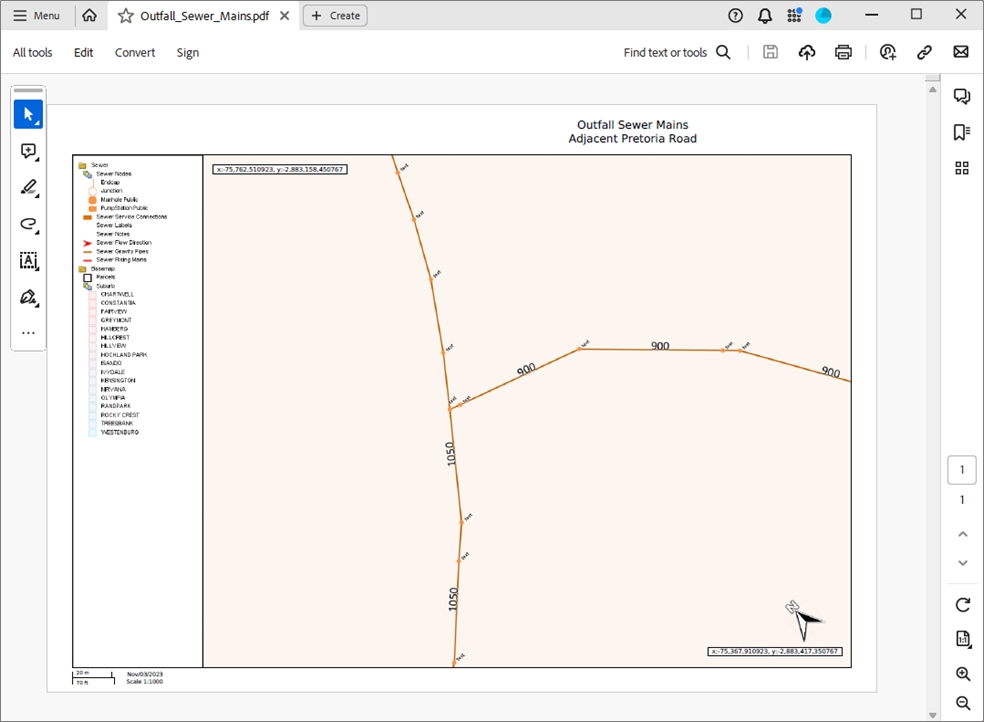
Fig: Quick Plot generated PDF file
 Bookmarks
When the Bookmarks icon ![]() is selected, the Defined bookmarks options will load as a floating pane on the user’s screen which is a new built-in function on enlighten. This floating pane allows the user to be dragged and placed at a convenient location as per the user’s preference. This pane can also be minimized or expanded, thus keeping this active whilst the user continues with other actions on enlighten. Lastly, this floating pane can also be made transparent thereby enabling the user to dock this anywhere on the map without obstructing other panes.
is selected, the Defined bookmarks options will load as a floating pane on the user’s screen which is a new built-in function on enlighten. This floating pane allows the user to be dragged and placed at a convenient location as per the user’s preference. This pane can also be minimized or expanded, thus keeping this active whilst the user continues with other actions on enlighten. Lastly, this floating pane can also be made transparent thereby enabling the user to dock this anywhere on the map without obstructing other panes.
The bookmarks available in the drop-down list are those bookmarks that have been saved as Public Bookmarks or those that the user has saved as their own Private Bookmarks. After you navigate to a specific location on the map, you can save the current view of the map as a bookmark. A bookmark saves all the information about the current view of the map under a name you specify. By using the bookmark in the future, you can go directly to this same view of the map without having to zoom and pan again.
Save a New Bookmark
To save a new bookmark, first navigate to a location on the map and then save the current view of the map under a name that you specify. The bookmark names must be unique and not longer than 40 characters in length.
- Select the Bookmarksicon.
- Select the New button from the Defined Bookmarks options.
- Enter in a bookmark name in the text box.
- Select whether the bookmark is Private or Public.
- Select the Save button.
- The Bookmark is saved to the database for future use.
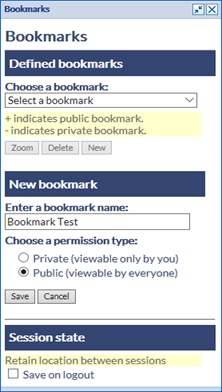
Fig: Defining a new Bookmark - The Session State tick-box option Save on Logout will, if checked, retain the last zoomed map location (screen center X;Y position and map scale), and return to the same map location and zoom scale when the user opens a new enlighten session.
Zoom to a Bookmark
To zoom to a previously saved bookmark you simply select the Bookmark icon from the toolbar and follow the steps below.
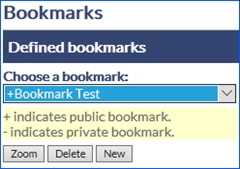
Fig: Zoom to a saved Bookmark
- Select the Bookmarks icon.
- Choose a Bookmark name from the drop-down list.
- Select the Zoom button
- The map zooms to the map extents of the bookmark when it was saved.
Delete a Bookmark
To delete a Bookmark, you simply select the Bookmark icon from the toolbar and follow the steps below. The Bookmarks can only be deleted one at a time.
- Select the Bookmarks icon.
- Choose a Bookmark name from the drop-down list.
- Select the Delete button
- A confirmation message is displayed where the OK button will delete the Bookmark from the database and the Cancel button will cancel the deletion and return to the map.
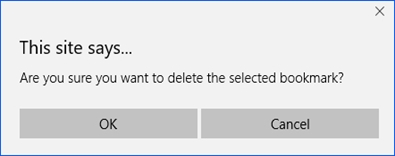
Fig: Confirmation message when deleting a BookmarkNote: The Bookmark functionality is not available to external users and will only be visible to internal users. For more information on User types please refer to Manage Users and Permissions in the enlighten Administrators Guide.
 Show / Hide Tooltips
Tooltips are defined when the layer is configured in MapGuide Maestro and are designed to provide additional information about the map feature when the mouse is hovered over the feature, rather than to actually select the feature to display in Basic Info or Show Info panes. The Show/Hide Tooltips icon is a toggle feature which switches the mouse-over tool-tips either on or off.
The right-click context menu OPTIONS > Feature Tooltips ON/OFF toggle button also updates the Show /Hide Tooltips icon to be ON/OFF.
 Measure
The Measure tool is a measuring ruler which calculates the distance between two or more selected points on the map, or calculates the area of a polygon shape and the segment lengths traced on the map. The Measure tool opens the MapGuide Task Pane with the Measurement pane and shows the Length distance/s and total distance in the units as setup in the Map Projection. The user has the option to measure Length (LineString) or Area (Polygon) by selecting the required measurement type from the drop-down list.
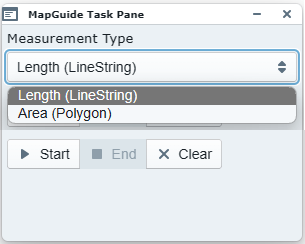
Fig: Measurement Type Selection
The unit displayed within the measure tool pane is determined by the UNIT defined in the Map Projection setup for the enlighten base map. If the UNIT parameter in Projection definition is set to Feet, the measuring length is displayed in ft, and conversely, if the UNIT parameter in Projection definition is set to Meters, the measuring length is displayed in m.
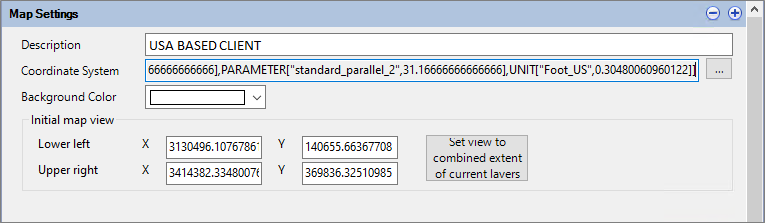
Fig: Coordinate System definition setup for Projection LA83-NF using Feet
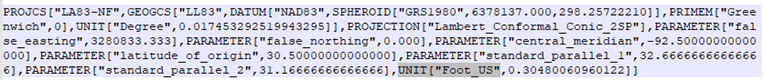
Fig: Map Projection definition indicating Units set to Foot_US
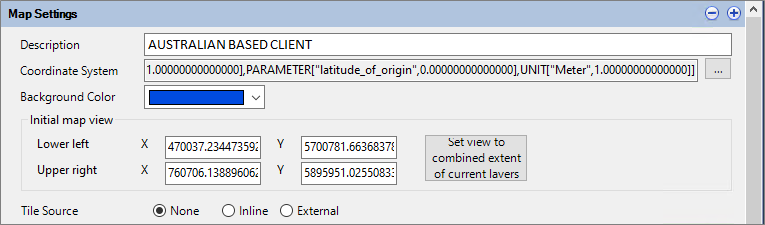
Fig: Coordinate System definition setup for Projection MGA/20-54 using Meters
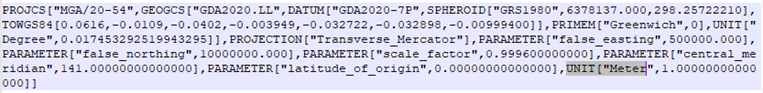
Fig: Map Projection definition indicating Units set to Meters
To start measuring a Length do the following:
- Select the Measure icon from the enlighten toolbar.
- Select the Measurement Type required from the drop-down list, i.e. Length.
- The first time the Measure command is used in the session, the measure command is immediately active and the Measure Pane displays the message You are currently measuring and the user is prompted to Click to continue drawing the line. Double-click to finish.
- The user selects the first point on the map to measure from and thereafter, clicks on the map for the subsequent points to measure multiple distances.
- The user can double-click to finish measuring where a temporary geometry (yellow line in the example below) is displayed on the map indicating the path measured, and the Measure pane shows the distance of the individual segments traced.
- If the user selects the End button without first double-clicking to finish measuring, the temporary geometry is erased and the user must select the Start button to re-start measuring.
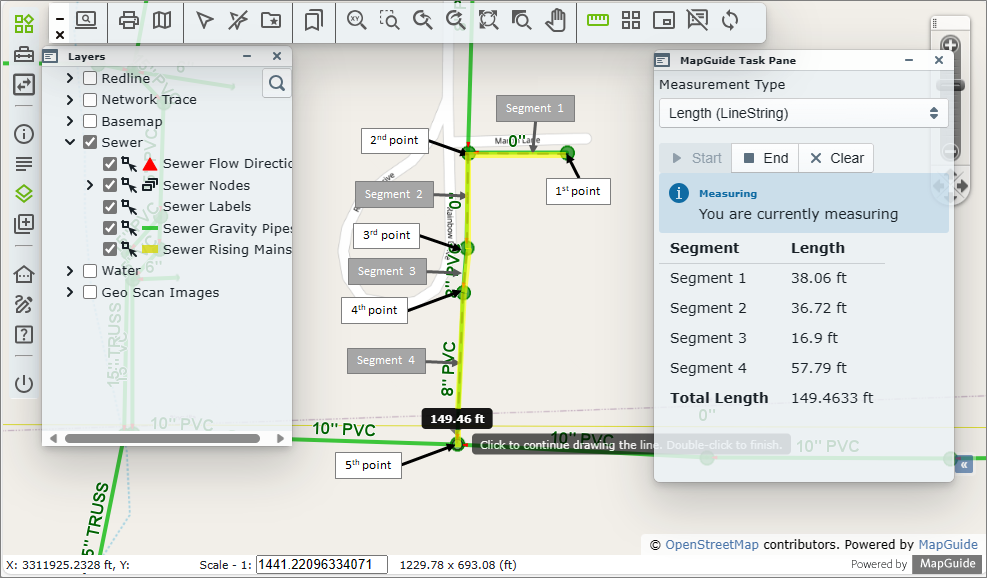
Fig: Example of measuring Length where distance is recorded in feet (ft) - When selecting the Clear button, the measurement lines are cleared from the map and the segment measurements in the Measure pane are reset.
- Select the X in the top right corner of the Measure pane to close the Measure pane.
To start measuring an Area do the following:
- Select the Measure icon from the enlighten toolbar.
- Select the Measurement Type required from the drop-down list, i.e. Area.
- The first time the Measure command is used in the session, the measure command is immediately active and the Measure Pane displays the message You are currently measuring and the user is prompted to Click to continue drawing the line. Double-click to finish.
- The user can select the first point on the map to measure from.
- Thereafter click on the map for the subsequent points to measure multiple distances. Notice that for Area selection the temporary geometry is always closed at the initial starting point.
- The user can double-click to finish measuring where a temporary geometry (yellow line in the example below) is displayed on the map indicating the polygon measured, and the Measure pane shows the distance of the individual segments within the polygon.
- If the user selects the End button without first double-clicking to finish measuring, the temporary geometry is erased and the user must select the Start button to re-start measuring.
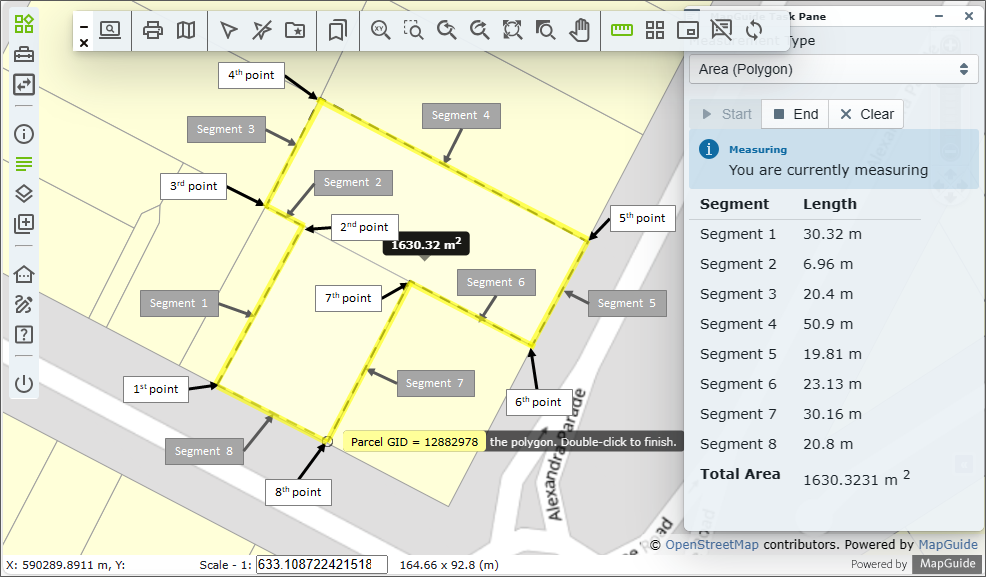
Fig: Example of measuring Area where distance is recorded in meters (m) - When selecting the Clear button, the measurement lines are cleared from the map and the segment measurements in the Measure pane are reset.
- Select the X in the top right corner of the Measure pane to close the Measure pane.
Redlines
Enlighten’s Redline functionality is a critical feature for managing field-based discrepancies and issues. They enable field inspectors to identify and record differences between what has been constructed and what is documented in the GIS database, as well as to flag issues in the field that require attention. Redline Markups support the capture of spatial features—such as lines, polygons, circles, and text annotations—along with a description and status. These elements allow issues to be tracked from the time they are identified in the field to the point when they are resolved, updated in the GIS database, and formally closed out by the responsible personnel.
The Redline functionality on the Redline Toolbar and Redline Task Pane includes the creation and management of:
- Redline Project Layers
- Redline Collections
- Redline Projects
- Redline Project Stages
- Redline Layers can be generated for the different departments within the organization, enabling teams to create, view, and manage redline markups specific to their responsibilities throughout each project stage. Redline Notifications are setup per Layer to notify specified users or user groups by email whenever redline markups have been created or actioned.
Redline Layers can be created for individual departments across the organization allowing the various teams to generate, view, and manage redline markups which are relevant to their roles and responsibilities at each stage of the project. Additionally, Redline Notifications can be configured per layer to automatically alert specific users or user groups when new redline markups are created or are updated.
- Redline Collections allow redline editors to group multiple redline objects into a single, named collection. Collections are created by selecting redline objects on the map and grouping them using the Redline Pane on the selected layer. Each Redline Collection must be assigned a unique name. Collections can be associated with a specific Project or maintained independently.
- Redline Projects for utilities, construction and infrastructure typically manage the improvement, modernization and expansion of infrastructure or facilities, and the project extents are defined by Enlighten Map users by drawing a polygon on the map to specify the project boundary when a new project is created. Each project includes a unique name, description, and a status of either Active or Inactive. The project's attributes can be viewed and edited via the Show Info pane. The Redline markups can now be used to represent the project requirements in terms of improvements, replacement and/or rehabilitation of utility infrastructure as well as the expansion of existing services. The creation and/or assignment of a Redline Projects is optional meaning that Redline markups can be created without selecting a Redline Project.
- Project Stages are configurable and represent the current phase in the project life-cycle and are also stored as an attribute with the individual projects. These stages are updated and maintained by assigned Project Managers as the project advances from preliminary design through to completion. To safeguard sensitive information, user permissions can be configured for each Project Stage. This ensures that only authorized users can view or interact with projects at specific stages in the life cycle.
There are typically three primary user roles involved in the redline process:
- Redline Editor: Captures the initial redline markup feature during a field inspection and provides a detailed description of the required data correction or issue.
- Redline Manager: Oversees the resolution process, ensuring that corrections are implemented in the GIS and the markup is finalized and closed.
- Redline Project Manager: Oversees the Redline Project process and managing the transition through the various configure project stages.
The precise placement of redline features on the map indicates the exact location of each recorded issue. These features are organized and displayed within the appropriate configured Redline Layers in Enlighten, providing spatial context and traceability for effective issue management.
Typical Redline Markup Scenario
A field technician, otherwise identified as being a Redline Editor, who has access to enlighten from a mobile device would typically perform inspections on as-constructed assets while they are on site completing maintenance or repairs. If any anomaly is identified, the editor pinpoints the exact location on the map and draws a redline feature which adequately represents the issue identified. This redline markup is then captured on the mobile devise where the location and description of the issue is saved in the database.
The configured Redline Notifications then alerts the Redline Manager to a new markup being captured, where they can locate the redline feature on the enlighten map, read the description captured by the field technician and action the markup accordingly. At this point the redline notification status should be updated, or there maybe a requirement for more information from the field technician before the markup can be finalized.
The example below paints a simplified scenario where repairs on a water pipe burst identified differences of what is in the ground to what is represented on the map in enlighten. The scenario highlights the steps taken from where the field technician has replaced a pipe length as part of general repairs as the result of a pipe burst. The original pipe which burst was a 75 diameter HDPE pipe and has been replaced with a 100 diameter PVC Pipe, and the GIS needs to be updated with the new pipe diameter for the length of pipe replaced.
- The field technician identifies the water pipe replaced on the enlighten map and uses the Redline Markup tool to draw the length of pipe replaced.
- The layer to draw the redline feature on is selected from the drop-down list i.e. RL Water Assets. If the chosen layer is not switched on, it will be switched on when selected and visible in the Layers pane.
- On the Redline vertical toolbar the Polyline option is selected.
- A redline Polyine feature is drawn from the hydrant to the water pipe intersection.
- A user-defined line-style properties are adopted i.e. Color = Yellow, Thickness = 3, etc.
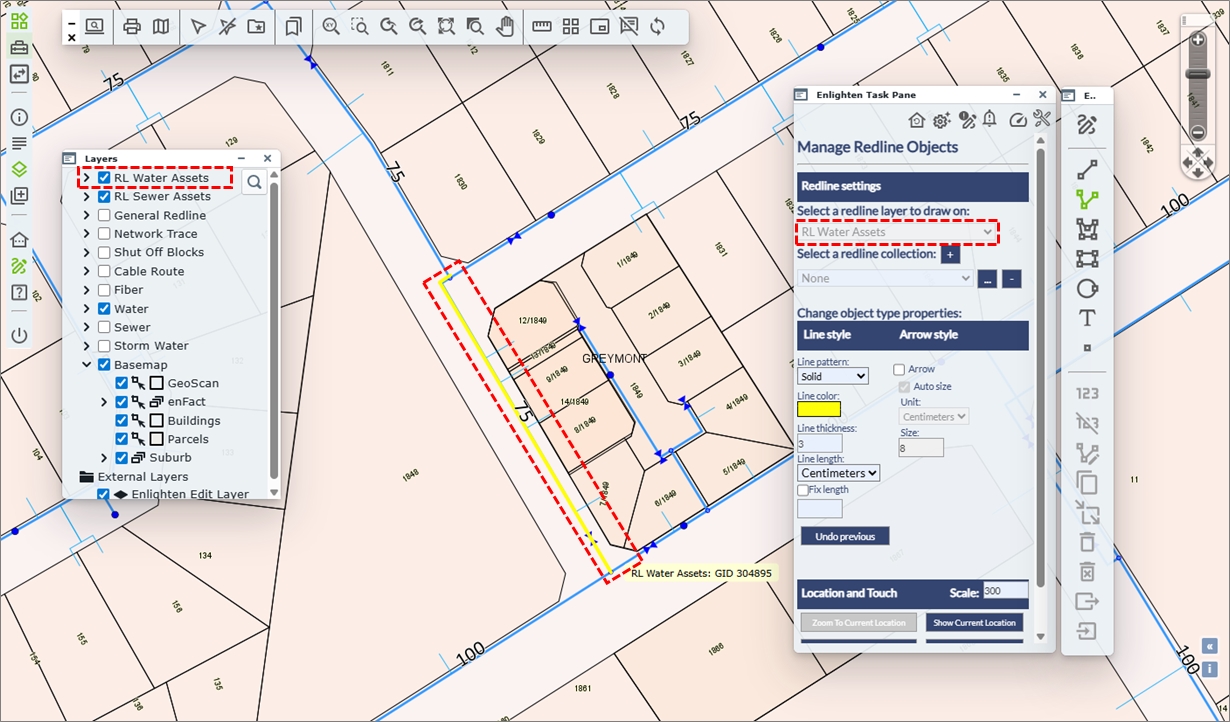
Fig: Capture Redline Markup for the length of water pipe replaced - The Notify button
 is selected where the Redline Notifications pane is displayed and the field technician can describe the update in the field.
- The Layer associated to the redline feature is selected from the drop-down list i.e., RL Water Assets
- The user selects the Redline object from the drop-down list based on the username, date and time i.e., JackiR_20250725:23:32:01
- A suitable description is entered in the Description field i.e., Water Pipe upgrade from 75 HDPE to 100 PVC
- The Status is set to Logged
- The Update button posts the entry to the relevant redline spatial table depending on the type of redline feature created.
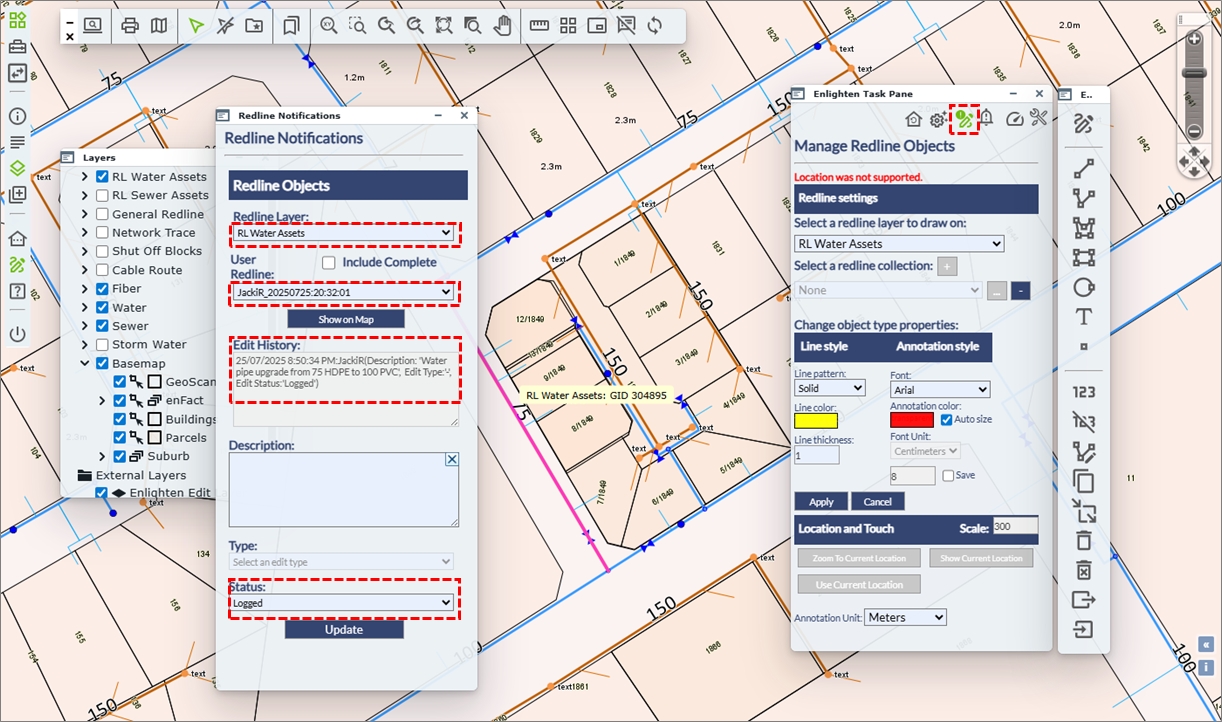
Fig: Redline Notification by Redline Editor - As part of the Redline Notification process, the Redline Manager receives an email notification indicating there is a new Redline markup requiring their attention. The redline notifications are setup per layer.
- When the Redline Manager opens their enlighten session, as they open the Enlighten Task Pane, the Redline Notification icon has changed from being Inactive
 to Active
  showing that a new redline markup requires attention.
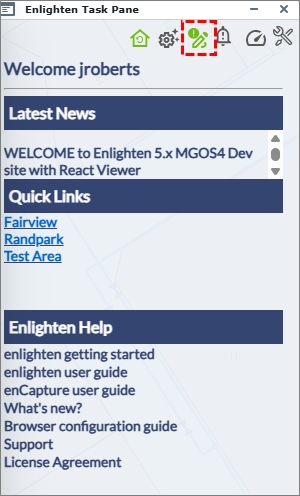
Fig: Enlighten Task Pane with Redline Notification active - Selecting the Redline Notification icon on the enlighten Task pane opens the Redline Notifications pane where the Redline Manager is able to navigate to the Redline Markup captured by the Field Technician.
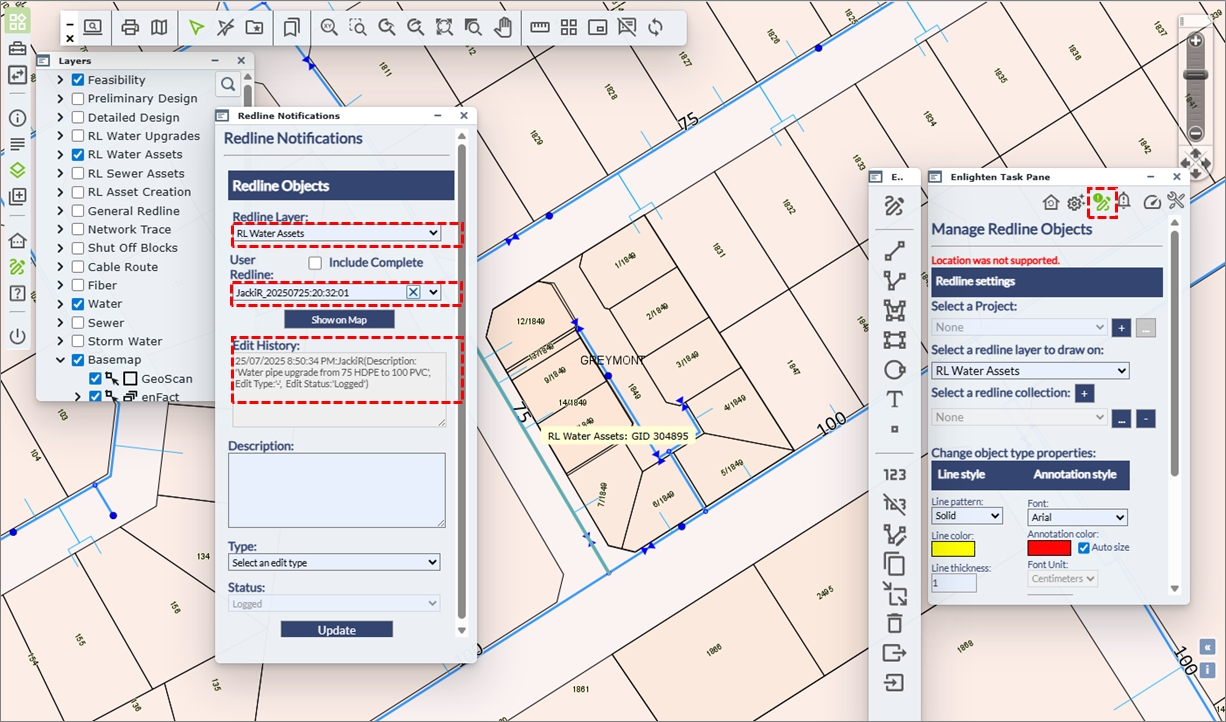
Fig: Redline Notifications opened by Redline Manager - The Redline Manager is now able to update the GIS and provide feedback on the updates.
- The Layer associated to the redline feature is selected from the drop-down list i.e., RL Water Assets.
- The user selects the Redline object from the drop-down list based on the username, date and time i.e., JackiR_20250725:23:32:01
- A suitable description is entered in the Description field i.e., Field Verification completed, Updated GIS and Asset Register
- The Type is updated by selecting an option from the drop-down list i.e., Field Verification
- The Status is updated by selecting an option from the drop-down list i.e., Logged
- The Update button posts the entry to the relevant redline spatial table depending on the type of redline feature created.
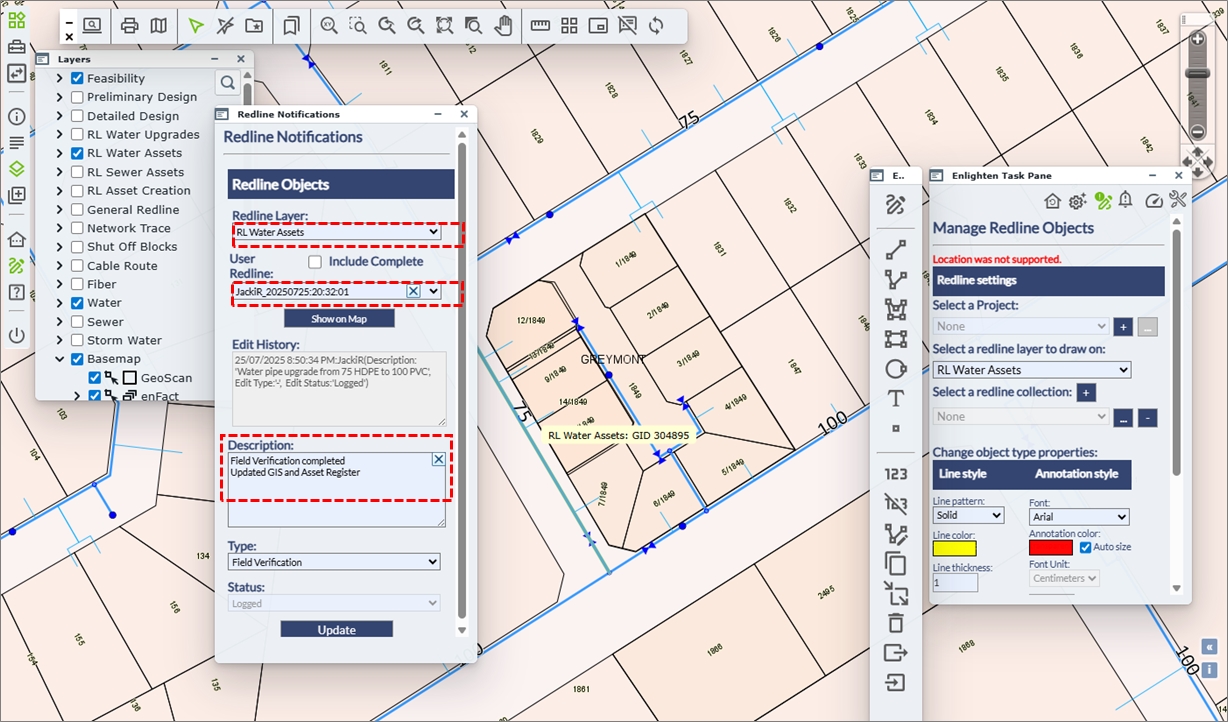
Fig: Update Redline Notifications by Redline Manager - Users can scroll through the historical records for the various redline markups.

Fig: Redline Notifications Updates are recorded
 Draw and Manage Redline Markups
The Manage Redline Objects pane allows users to select the layer on which redline objects will be drawn. Advanced functionality also enables the creation of new Redline Projects and Redline Collections.
The Redline Toolbar, working in conjunction with the Redline pane, offers tools for creating redline markup objects on specified layers, as well as options to annotate, copy, remove, import, or export these objects. Additionally, it allows selected Map Feature objects to be copied and converted into Redline objects. When a user selects a redline object type from the toolbar, a dedicated Redline pane appears, displaying the applicable properties for that object. These properties vary depending on the type of redline object selected. Redline objects are saved to the enlighten database, within the following tables: SP_REDLINE_POLYGON, SP_REDLINE_CIRCLE, SP_REDLINE_LINE, and SP_REDLINE_TEXT.
The GIS Administrator manages user permissions for Redline layers and Project Stages, and configures Redline Notifications. These notifications ensure that when a Redline markup is created, designated user groups or individual users are alerted and can take appropriate action.
Default Redline Pane State
When the Draw and Manage Redline Markups icon ![]() is selected on the Main Toolbar for the first time in a new enlighten session, the Manage Redline Objects pane, the Redline Toolbar, and the Layers pane are automatically displayed.
is selected on the Main Toolbar for the first time in a new enlighten session, the Manage Redline Objects pane, the Redline Toolbar, and the Layers pane are automatically displayed.
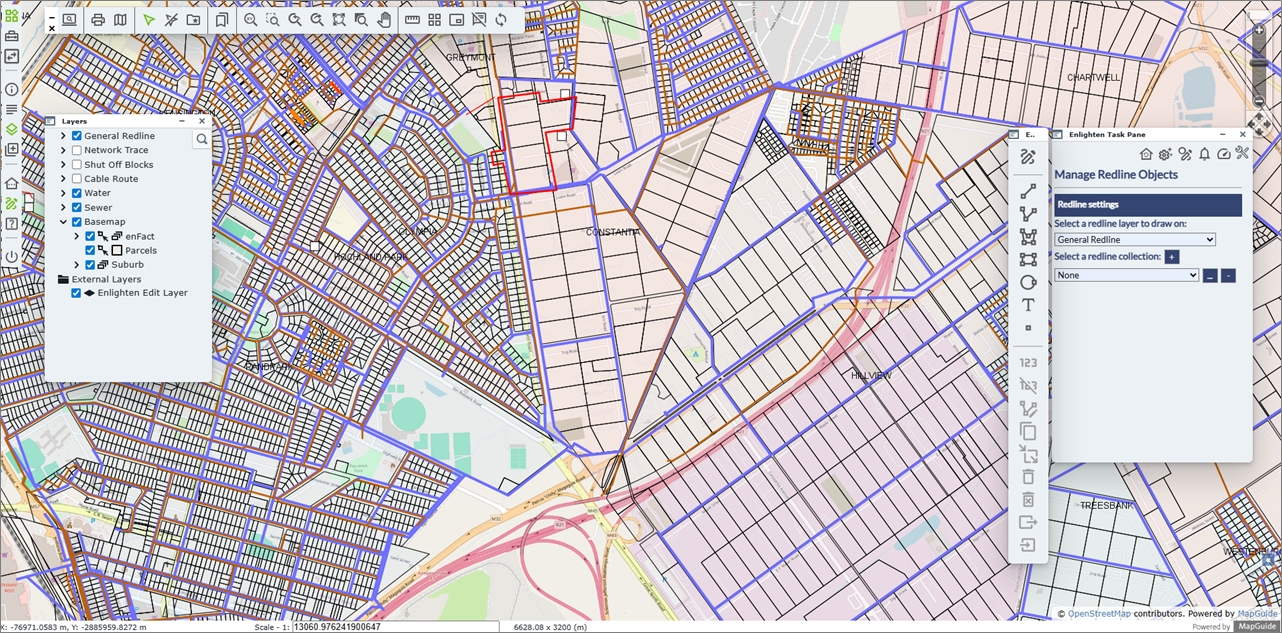
Fig: The Redline Pane, Toolbar and Layers Pane Default State for first time use
The Manage Redline Objects pane is displayed in the Default State described below:
- The Layer list displays the first Redline Layer assigned to the user by the Administrator.
- The Collection is set to None.
- The various functionality on Redline Toolbar only permits the capture of new redline markups.
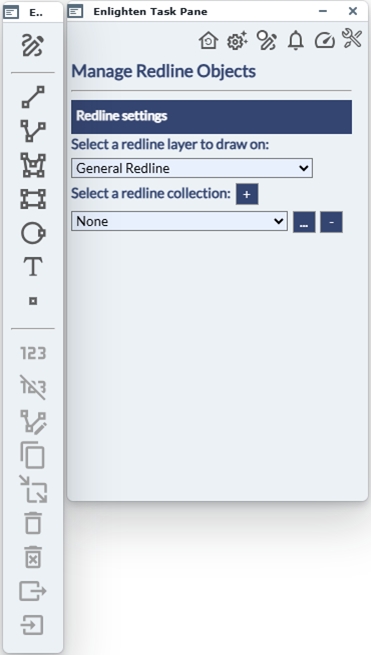
Fig: The Redline Pane and Toolbar Default State
Redline Toolbar
The Redline vertical toolbar is automatically loaded when the Draw and Manage Redline Markups is selected from the Main Toolbar, and has the following functionality.

Fig: The Redline Toolbar
 Show Pane: Opens the Redline Pane in it's default state.
 Line: Allows the user to draw a simple line on the map.
 Polyline: Allows the user to draw polylines on the map.
 Polygon: Allows the user to draw polygons on the map.
 Rectangle: Allows the user to draw rectangles on the map.
 Circle: Allows the user to draw circles on the map.
 Text: Allows the insertion of Text on the map.
 Symbol: Allows the insertion of a symbol on the map.
 Annotate: Annotates line and polyline lengths.
 Delete Annotation: Deletes selected annotation.
 Edit Annotation: Allows the user to edit the Annotation.
 Copy: Copies selected Feature or Redline objects to new Redline objects.
 Move: Allows the user to move the selected Redline object.
 Remove: Allows the user to remove the selected Redline objects, or to remove a selected Redline Project boundary.
 Remove All: Allows the user to delete all the Redline objects on the selected layer.
IMPORTANT: This function is only assigned to specified users by the Administrator via User Permissions. Export: Allows the user to export the selected Redline objects to a WKT or KML file.
 Import: Allows the Import of a KML file as Redline objects.
The state of the some of the Redline Toolbar functions will be greyed out if the functionality does not apply to the selection of objects on the map. The following toolbar functions are greyed out if only Map Feature objects are selected, since the functionality only applies to Redline objects:
- Move
- Remove
- Remove All
- Export
- Import
The following Redline Toolbar functions are available for the selection of either Map Feature objects or Redline objects.
- Annotate - only if linear objects form part of the selection, for example line or polyline objects.
- Copy
- Delete Annotation
- Edit Annotation
Draw a Redline Markup
To create a redline object follow the steps outlined below:
- Open the Draw and Manage Redline Markups icon from the Main toolbar.
- On the Redline pane, select a layer from the drop-down list of available layers on which the new object is going to be drawn.
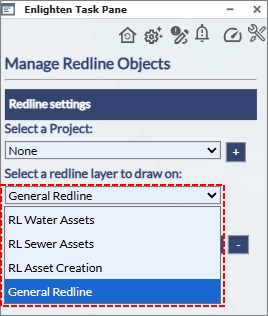
Fig: Select the Redline Object Type to draw. - If the selected layer is not yet displayed in the Layers pane, it will automatically be turned on, and a confirmation message is displayed at the top of the Redline pane.
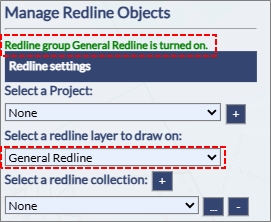
Fig: Confirmation Message when Layer is automatically displayed. - If no layers are available for selection ask your Administrator to grant access to a Redline Layer.
- From the Redline Toolbar, select the object type: Line, Polyline, Polygon, Rectangle, Circle, Text or Point. The formatting options on the Redline Pane will change depending on the object type selected.
- For Line and Polyline objects, the user can customize the line pattern, colour, thickness (1 smallest, 300 largest) and arrow size. Users can also specify the unit of measurement which the segment being drawn, is displayed in (Line length setting). This will only be populated for the Polyline feature as a single line is essentially just one segment.
A Fix length checkbox is also available where the user can set a fixed length for a given segment to be drawn in, to maintain consistency. When clicked the the segments of each object can the be defined individually or the user can maintain that length until the object is completed.
A tool-tip is displayed showing the Total distance (entire object) and Current distance (current segment). Tool-tips are only displayed for Polyline and Polygon objects, and will not be displayed for Rectangle or Circle objects.
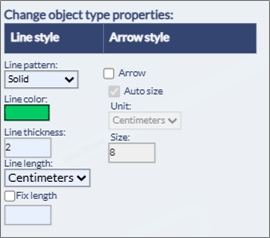
Fig: Redline Line Style Options - As Polygon objects are being drawn on the map, the current zoom distance and attempted length is calculated (in relation to the scale). If the specified fixed length, exceeds the current visible extent of the map, then a red border will outline the fix length dialog box and the following message will be displayed: “The length exceeds the limit of the current visible extent of the map”. Thereafter the display will be ignored.
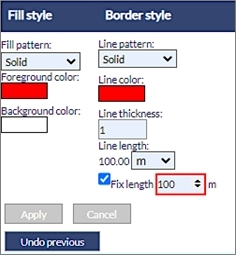
Fig: Fix Length notification - For Polygon, Rectangleand Circle object types, select the fill style and border style from the menu. Users can also specify the unit of measurement which the segment being drawn, is displayed in (Line length setting) and is disabled for the Rectangle feature. A Fix length checkbox is also available where the user can set a fixed length for a given feature to be drawn in, to maintain consistency.
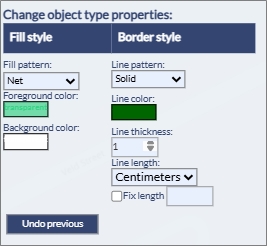
Fig: Redline Polygon Style Options - For Text, objects select the font and the font size, then enter the text in the text input box.
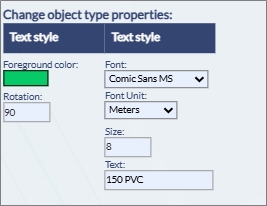
Fig: Redline Text Style Options - For Point objects select the symbol style and symbol attributes.
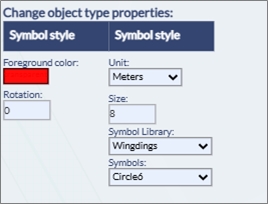
Fig: Redline Symbol Style Options - Place the Redline object on the map using one of the tools described below:
If an invalid colour has been selected for drawing redline objects, or if historical invalid entries are detected in the database, the system will automatically revert these invalid colour codes to the default redline colour: Red. This built-in "safety feature" in Enlighten ensures the integrity of redline data by preventing the use of non-existent or unsupported colour codes.- Line Tool
This tool allows the user to draw a simple line on the map. After selecting the Line tool button, click and drag on the map, navigate to the end point and let go of the mouse button to record the end point. A line will be created between these two points and stored in the redline layer. An arrow-head will be drawn at the endpoint of the line if the Arrow check-box is selected.
- Polyline Tool
This tool allows the user to draw polylines on the map. After selecting the Polyline tool button, click on the map to place the start point. Each additional click will add a new segment to the polyline. Double click on the map to finish drawing the polyline. The polyline will be created and stored in the selected redline layer. An arrow-head will be drawn at the endpoint of the line if the Arrow check-box is selected.
While placing a polyline markup, the user can click the Undo Previous button to return to the last point selected on the polyline. Clicking this button repeatedly will continue to step back through each previously placed point, one at a time, until reaching the initial starting point.
- Polygon Tool
This tool allows the user to draw polygons on the map. After selecting the Polygon tool button, click a point on the map to start drawing the polygon. Each additional click will add a side to the polygon. Double click on the last vertex to finish drawing, the polygon will be closed automatically.
While placing a polygon markup, the user can click the Undo Previous button to return to the last point selected on the polygon. Clicking this button repeatedly will continue to step back through each previously placed point, one at a time, until reaching the initial starting point.
- Rectangle Tool
This tool allows the user to draw rectangles on the map. After selecting the Rectangle tool button, click and hold down the mouse button where one corner of the rectangle should be located. Drag the mouse outwards to extend the rectangle. Release the mouse button at the required point and the rectangle will be created and stored in the redline layer.
- Circle Tool
This tool allows the user to draw circles on the map. After selecting the Circle tool button, click and hold down the mouse button where the centre of the circle should be located. Drag the mouse outwards to increase the radius of the circle. Release the mouse button at the required radius and the circle will be created and stored in the redline layer.
- Text Tool
This tool allows the insertion of Text on the map. After selecting the rotation, size, style, and colour type in the text to be displayed and click on the map to place it. The size together with the type of unit can should be defined by the user.
- Symbol Tool
This tool allows the insertion of a symbol on the map. After selecting the rotation, size and type of symbol click on the map to place it. When using this function for the first time, please clear the browser cache.
Users would now be able to define the line colour and line thickness whilst having the relevant tool active hence this changes the redline feature on the fly. This customization would be useful in situations when aerial imagery is active and the redline features are not distinctly visible to the user.
Note: The redline priority draw order would be Text, Symbol, Line, Circle and lastly Polygon. This means that the user would be able to edit/select overlapping redline features and would not be limited to the last drawn/polygon redline feature only. -
- To add a notification to the new Redline object select the Notify button.
Note: The Notify button will only be visible when redline layer notification is enabled. Information on how to enable redline notifications can be found in the enlighten Administrators guide. 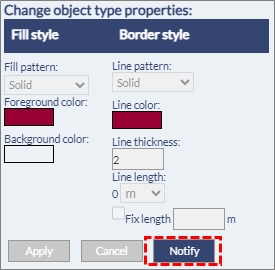
Fig: New Redline notifications - Define the notification by typing in a meaningful Description, selecting a Type from the drop-down list.
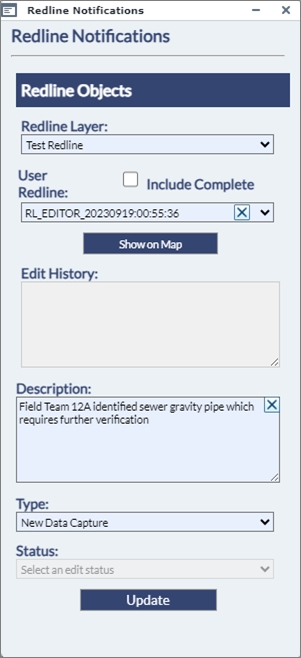
Fig: Redline Notifications dialog box - Click the UPDATE button to submit the notification.
The username of the person who logged the Redline Notification is added in the following format user_YYYYmmdd:HH:mm.ss, for example: RL_EDITOR_20230919:00:55:36
Editing Redline Objects
Extra redline tools are available on the Redline Toolbar. The tools available are:
- Annotate line lengths
- Delete Annotated line lengths
- Edit Annotated line lengths
- Copy to redline
- Move object
- Remove selected redline objects
- Remove all redline objects from layer
- Export Redline Layer
- Import Redline Layer
To use the Redline Object Tools follow the instructions below:
- Select the Redline Tool from the enlighten toolbar.
- In the side pane that opens, select the layer you wish to work on.
- Follow the instructions below regarding the Redline Object Tool that you want to use.
- Annotate Line Lengths
This tool allows the user to annotate existing line and polyline objects with their lengths. First select the lines that need to be annotated, then click on the annotate line lengths button.
Annotated line lengths will be saved to a temporary map layer called Annotations, however if the user wishes to have this saved permanently to the Redline Text layer then the Save checkbox must be ticked on.
Note: Selected objects do not have to be on the same layer and that the tool will work for both redline and non-redline objects. - Delete Annotated Line Lengths
This tool allows the user to delete existing annotated line and polyline lengths. First select the annotated text that need to be deleted, then click on the Delete Annotated line lengths button.
- Edit Annotated Line Lengths
This tool allows the user to edit existing annotated line and polyline objects lengths. First select the annotated lines that need to be edited, then click on the Edit Annotated line lengths button. The units can be altered here to allow the user to display the unit of preference.
- Copy to Redline
Copy to Redline allows one or more selected map feature objects to be copied to the nominated redline layer. The objects selected do not have to be on the same layer, and the selection set can be a combination of point, line, polyline, circle, polygon and text objects. If a selected object is a multi-line or a multi-polygon object, two separate objects, with different GID values, will be copied to the corresponding Redline spatial table, i.e., SP_REDLINE_LINE or SP_REDLINE_POLYGON.
- Select the objects on the map.
- Select the desired redline layer from the drop-down list in the side pane.
- Select the Copy to Redline Tool.
- All selected objects will be copied to the nominated Redline layer.
The selected features will be copied to the nominated redline layer
Note: Any object attributes that cannot be extracted will default to the relevant current setting on the redline menu - Move Object
This tool allows the user to move redline objects to another location within the map in the same redline layer. First select the object that needs to be moved, activate the Move Object tool and then click on the map where the object will be moved to. Only one object can be moved a time.
- Remove Selected Redline Objects
This tool allows the user to delete selected Redline objects and Project Boundaries from the map. First, select the object(s) that needs to be removed from the map and then click the Remove Object tool button to delete them.
Note: Multiple selected objects must reside on the same redline layer. - Remove All Redline Objects from Layer
This tool allows the user to delete all the redline objects in the selected redline layer from the map. First, choose the redline layer to delete from the layer drop-down box and then click on the Remove All Objects tool button. A warning message will appear asking to proceed or to cancel the operation.
Note: If the Delete All Redline Objects is not ticked within the User Admin > Manage User & Permissions > Functions tab, then that function is removed here and will not be visible. - Export All Redline Objects from Layer
This tool allows the user to export all the objects in the selected redline layer to a WKT or KML file, or to the database and to share them with other enlighten users. First, choose the redline layer to be exported from the layer drop-down box, and then click on the Export All Redline Objects from Layer tool button. The Export screen will appear. There are several options for exporting redline objects:
- Users can opt to export All Redline Entities on a specified Layer, or only Selected Redline Entities.
- To export to the database, select option Export layer to Oracle database. Thereafter the user should enter the Source Layer to be exported. Lastly, the user should specify an Export Name. This will save the redline layer to the SP_REDLINE_EXPORT table.
- To export to a file, select Export layer to a file on your device. Thereafter the user should enter the Source Layer to be exported. Lastly, the user should specify an Export Name. This file will be saved as either a WKT or KML file format, depending on which file format was selected.
- Import Redline Objects to Layer
This tool allows the user to import a previously exported redline layer (from a file or from database export) into either a nominated redline layer or into a new layer. After clicking on the Import Redline Objects to Layer tool button, the Import screen will appear. There are several options for importing redline objects:
- The user can import a redline layer from a file on the device. The user will need to specify a Destination Layer from the drop-down list. This list corresponds to the Redline Layers they have been granted access to.
- The user would then need to choose the Select File... option where they are taken to the Browse Screen to navigate to the required file location.
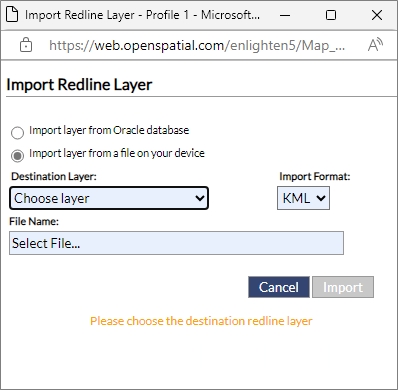
Fig: Import Redline layer - Once the redline .WKT or KML file has been selected the user can click on Submit and this will Import the redline layer into the Destination layer which was specified.
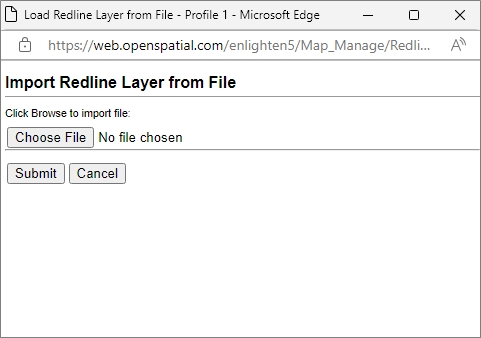
Fig: Import Redline layer from a file - When importing KML files, the KML file is read and digitized onto the selected redline layer and the configured default symbol is applied for point objects. For more information on how to setup the default redline symbol, please see the Network Trace and Redline Configuration Settings topic in the enlighten Installer document available to administrator users in the enlighten Site Administration documentation section.
- The user can also import a redline layer from an Oracle database. Here the user will be prompted to enter in the Database source and then the Destination Layer to which the redline layer will be imported. Once done the user can click on the Import button to complete this function.
Note: It is imperative that when importing any Redline objects to the Oracle database, the existing table structures are well understood. There are different tables for each of the different redline spatial object types, namely: SP_REDLINE_CIRCLE, SP_REDLINE_LINE, SP_REDLINE_POLYGON and SP_REDLINE_TEXT. It is therefore important that only Circle objects types be imported into the SP_REDLINE_CIRCLE table, and only Line objects types be imported into the SP_REDLINE_LINE table, etc.
-
Changing Properties of Redline Objects
The styling properties of Redline objects can be changed either at the point of capture or can be edited after placement. The styling properties to be edited differ depending on the type of Redline object drawn. Redline objects with an area, such as a Polygon, Rectangle or Circle can have a fill pattern assigned, whist a Redline object such as a Line or Polyline can have a Line Pattern assigned. When selecting Redline objects to stylize, only objects of the same type can be stylized at the same time.
When placing or editing Text and Symbol redline object types, the Unit of measurement and Size determines the size of the object on the map. If your Map Units are configured for Meters, then apply the same unit of measurement and then change the size. The Font Style can be changed but this changes the Font Style for all Redline Text on the same layer, since the font style forms part of the redline layer setup, and not the individual Text object.
If more than one Type of Redline object is selected, the Manage Redline Objects pane will display the message Multiple Redline Geometry Types selected. Select a single Geometry type to enable Change Properties and all styling functions are hidden. To continue with styling Redline objects, clear the selection and only select objects of the same type.
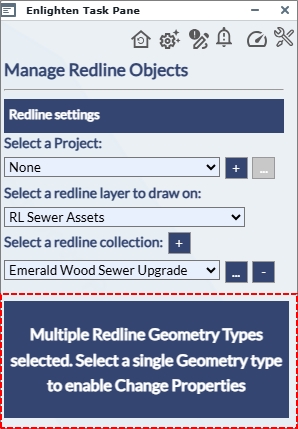
Fig: Error message when selecting Redline objects of different Types for editing
- The styling properties available for Redline Line and Polyline objects include the following:
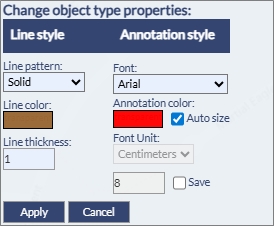
Fig: Redline Properties for Line and Polyline Redline Objects- Line Pattern
Is the pattern applied to the line drawn which defaults to Solid, however there are 9 different basic Line Patterns to chose from.
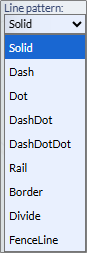
- Line Color
Color picker allows the user to pick a colour from the grid, or to enter a RGB or Hex code.
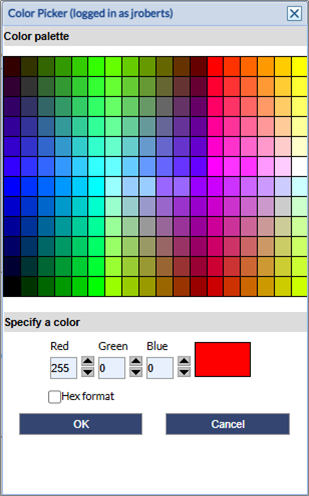
To select the Hex code, check the tick-box next or hex and elect or enter a HEX value
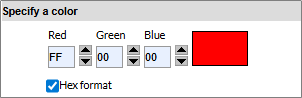
- Line Thickness
The line thickness is a numeric value which can be entered manually
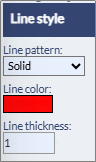
- Annotation Font
In the event any annotation for the Line Object is added using the Annotation function, the default annotation styling for the Line object will be applied.
If the Auto size tick-box is un-checked, the user can manually edit the Annotation Font Unit and Size.
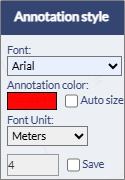
A different Font Style can be applied by selecting a style from the drop-down list.
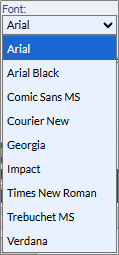
- Font Unit
It is suggested that the Font Unit be set to the same Unit of measurement as the Map Unit i.e. Meters or Feet.
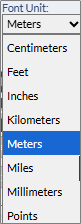
- Font Size
The Font Size is a numeric value which can be entered manually and is relative to the Font Unit selected.
- Line Pattern
- The styling properties available for Redline Polygon, Rectangle and Circle objects include the following:
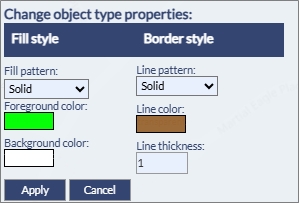
Fig: Redline Properties for Polygon, Rectangle and Circle Redline Objects- Fill Pattern
Is the Fill pattern applied to the Polygon, Rectangle or Circle drawn. The default Fill is Solid, however there are other Fill patterns to select from. Selecting None will not apply any Fill pattern.
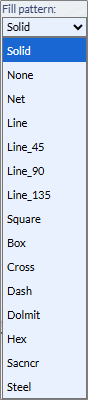
- Foreground Color
This is the color applied to the Fill pattern selected above. The user is required to select a Color from the Color Palette where the Transparency can also be set.
Moving the Transparency scroll bar to the far right will set the transparency to 100%, while moving the scroll bar to the far left will set the transparency to 100% opaque.
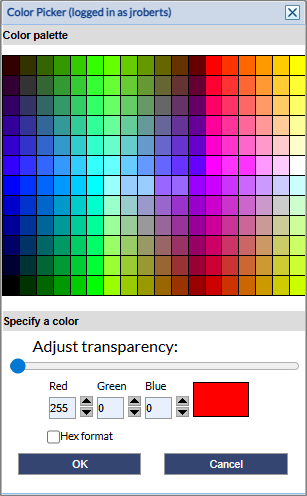
- Background Color
This is the Background colour applied to underneath the Fill colour, so if a Net Fill pattern has been selected, this is the color seen between the net fill. The user is required to select a Color from the Color Palette where the Transparency can also be set. - Line Pattern
This sets the Line style for the perimeter line defining the extents of the object. The user is required to select pattern from the drop-down list.

- Line Color
This is the color applied to the object perimeter line where the user is required to select a Color from the Color Palette and the Transparency can also be set. - Line Thickness
The line thickness is a numeric value which can be entered manually
- Fill Pattern
- The styling properties available for Redline Text objects include the following:
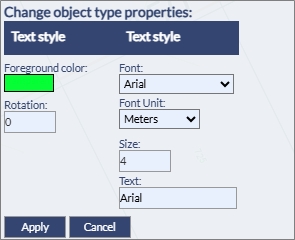
Fig: Redline Properties for Text Redline Objects- Foreground Color
This is the color of the text where the user must select a color from the Color Palette and the Transparency can also be set.
- Rotation
This is the rotation of the text entered as degrees only i.e. 22. - Font
The user can either accept the default Font Style of Aerial, or change it to one of the fonts in the drop-down list. Changing the Font Style for the selected red line text object changes the Font for all Redline Text on the same layer, since the font style forms part of the redline layer setup, and not the individual Text object.

- Font Unit
This refers to the Text Units which are selected from a drop-down list.

- Font Size
This refers to the text size where the user enters in a value relative to the Text Units entered previously. - Text Value
This is the text value that will be drawn on the selected map layer. If no value is entered, the Font Style is written as a place holder, i.e. Aerial.
- Foreground Color
- The styling properties available for Redline Symbol objects include the following:
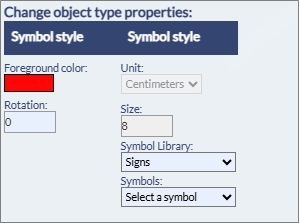
Fig: Redline Properties for Symbol Redline Objects- Foreground Color
This is the color applied to the symbol where the user must select a color from the Color Palette and the Transparency can also be set.

- Rotation
This is the rotation of the symbol entered as degrees only i.e. 22. - Unit
This refers to the Symbol Units which are selected from a drop-down list.
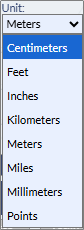
- Size
This refers to the Symbol size where the user enters in a value relative to the Symbol Units entered previously. - Symbol Library
This refers to the pre-configured Symbol Library added as part of the map authoring in MapGuide Maestro. Contact your Administrator for more details.
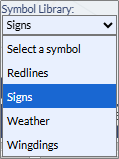
- Symbol Name
For each Symbol Library added, there are symbol names to select from the drop-down lists.
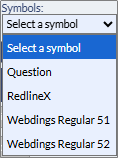
- Foreground Color
- When editing any styling properties for any of the selected Redline objects, ensure that the Apply button is selected after the changes have been made to effect the changes.
Deleting Redline Objects
Before any redline objects can be deleted, they need to be selected on the map. This selection can contain redline objects on different redline layers. If Map Feature objects and Redline objects form part of the selection, the Map Feature objects will be filtered out, and only the selected Redline objects will be deleted.
- Open the Draw and Manage Redline Markups icon from the Main Toolbar.
- Select the redline objects on the map to be deleted by using the Selection command
 on the Enlighten toolbar
 - On the Redline Toolbar, select the Remove command
- If the layer on which the selected redline objects has been drawn has been configured for Notifications, the following confirmation message is displayed where the user must select the OK button before the redline objects are deleted.
Note: All Redline Markup objects forming part of the Collection will be deleted.
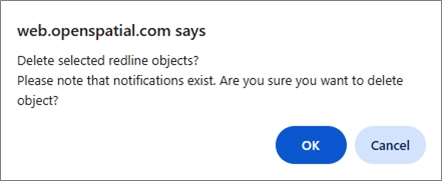
Fig: Confirmation message before Redline objects with Notification configured is deleted - If the layer on which the selected redline objects has been drawn has not been configured for Notifications, the following confirmation message is displayed where the user must select the OK button before the redline objects are deleted.
Note: All Redline Markup objects forming part of the Collection will be deleted.
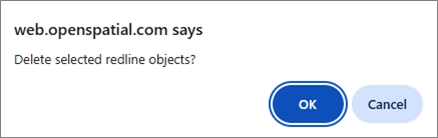
Fig: Confirmation message before Redline Object without Notification configured is deleted
Creating a Redline Collection
A Collection is a group of Redline objects which can comprise of different redline object types. To create a new collection complete the following steps:
- Open the Draw and Manage Redline Markups icon from the Main Toolbar.
- Select a Redline Layer to draw redline objects by choosing one from the drop-down list of available redline layers.
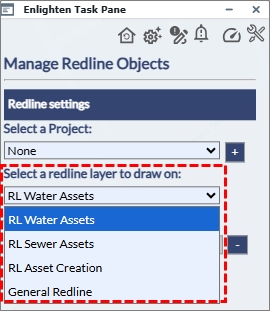
Fig: Select Redline Layer on which to create redline objects - Next to the option Select a redline collection press the plus sign + to open the Collection Name text box.
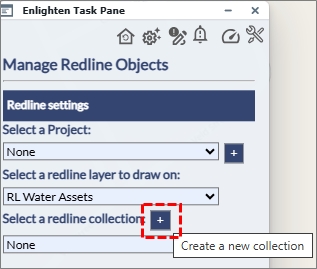
Fig: Open New Collection text box - Enter a unique Collection Name and then select the '>' button to save.
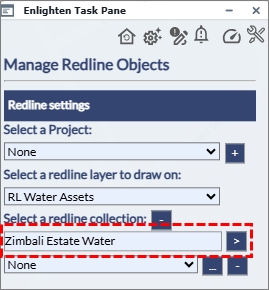
Fig: Save Collection - If the Collection Name entered is not unique, the following error message is displayed, and you are required to re-enter a unique Collection Name.
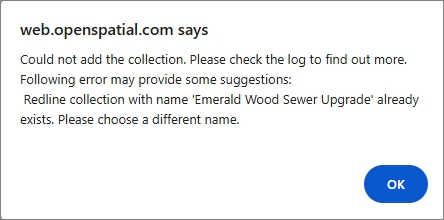
Fig: Error message for non-unique Collection names - Once correctly entered, the Collection Name is set for the start of capturing Redline Markup objects.
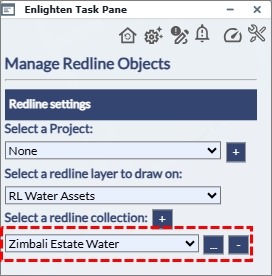
Fig: Collection Layer and Name set for Capturing new Redline Marup objects - Select a Redline object from the Redline toolbar where the Manage Redline Objects pane allows the user to change the styling.
Note: The Layer and Collection names are locked for the duration of the redline markup capture.
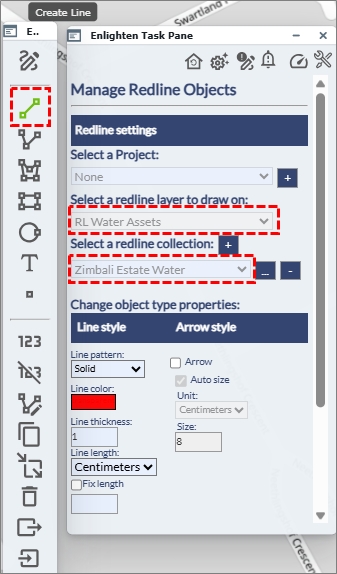
Fig: Capture Redline Objects for the Collection - Continue to capture the Redline markups by selecting the relevant objects from the Redline toolbar.
Note: A Collection can comprise of a combination of different Redline object types. - All subsequent Redline objects drawn will be added to the Collection until the Redline pane is refreshed and returns to the Default Pane State.
Locate a Redline Collection
To locate a Redline Collection on the map, follow the steps below:
- Open the Draw and Manage Redline Markups icon from the Main Toolbar.
- On the Manage Redline Objects pane, first select a Redline Layer, and then select a Redline Collection from the drop-down list.
The list of Collections is filtered to only display those Collections associated to the selected Redline Layer.
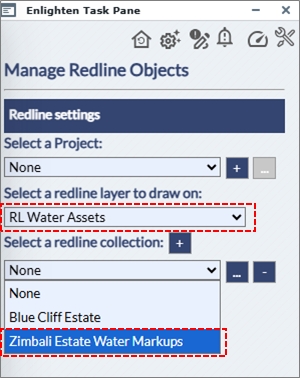
Fig: Select Redline Layer and the Associated Collection - The map is immediately zoomed to the extents of all objects forming the selected Collection.
All Redline objects forming part of the selected Collection are included in a Selection Set.
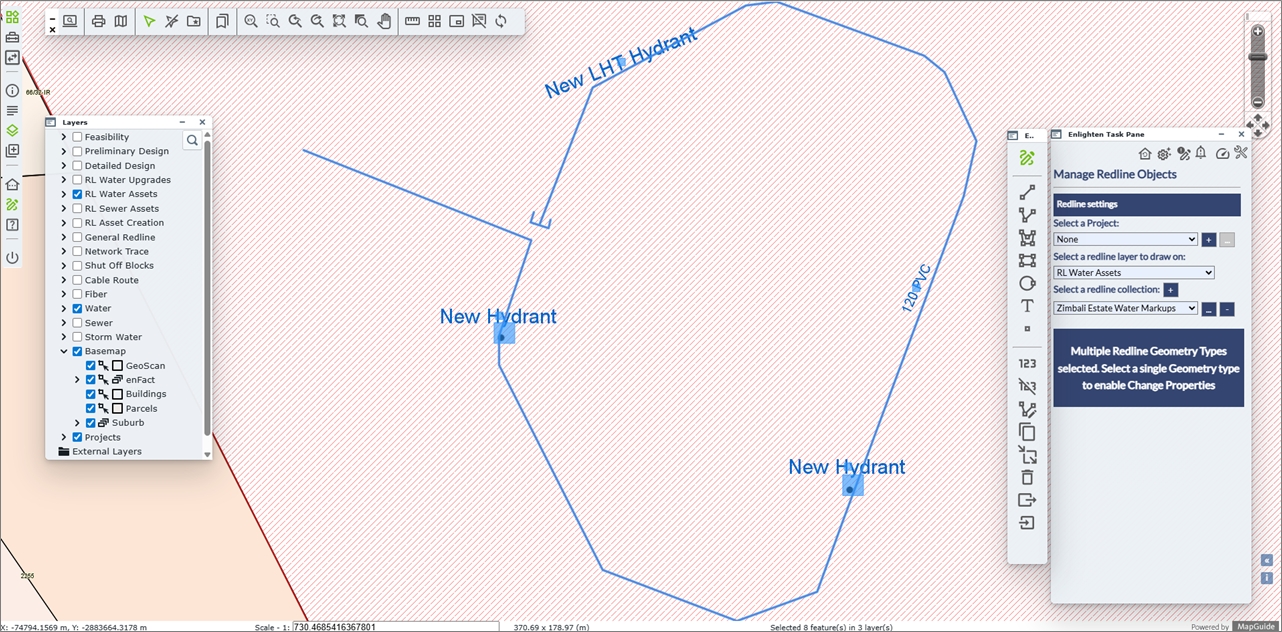
Fig: Map is zoomed to the extents of all Redline objects forming the Collection
Adding Redline Objects to a Redline Collection
To add Redline Markup objects to an existing Redline Collection, follow the steps below:
- Open the Draw and Manage Redline Markups icon from the Main Toolbar.
- On the Manage Redline Objects pane, first select a Redline Layer, and then select a Redline Collection from the drop-down list.
The list of Collections is filtered to only display those Collections associated to the selected Redline Layer.
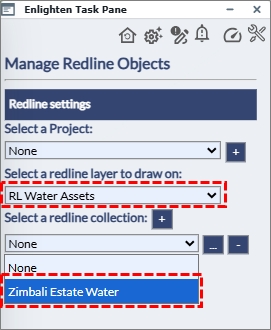
Fig: Select Redline Layer on which to add the redline objects to - Upon selecting a Collection, the map automatically zooms to the combined extents of all objects within the Collection.
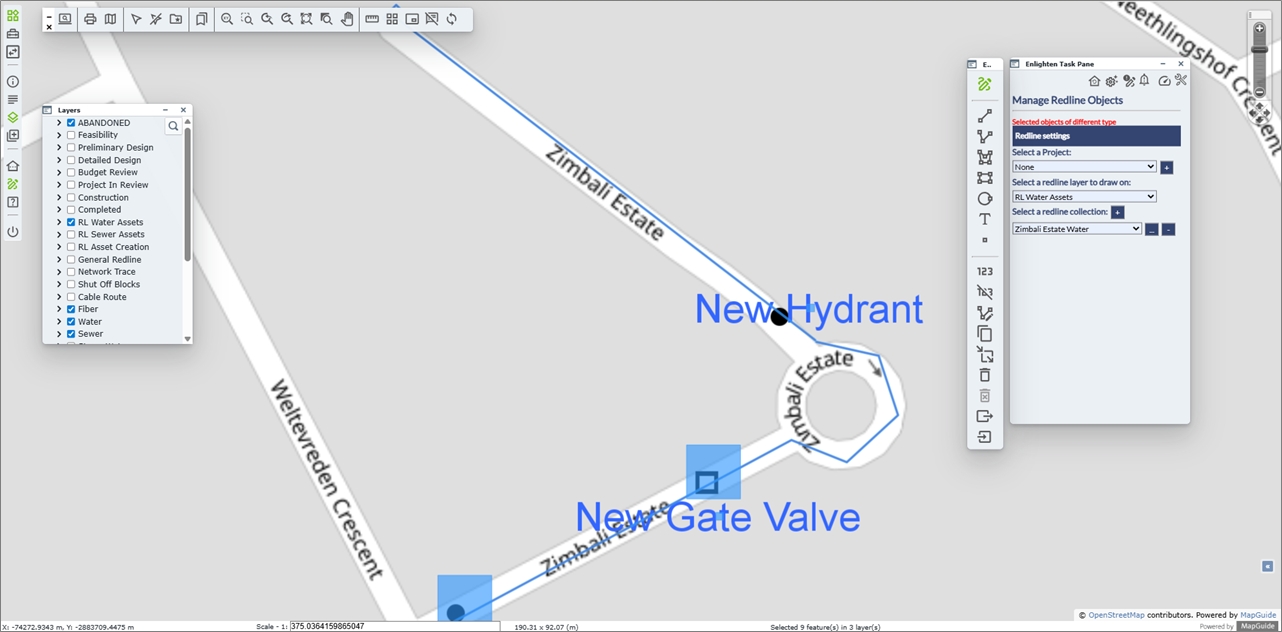
Fig: Map is zoomed to combined extents of all objects within the Collection - Select a Redline object to add to the collection from the Redline Toolbar.

Fig: Select a Redline Markup to capture from the Redline toolbar - Continue to capture the Redline markups by selecting the relevant objects from the Redline toolbar.
- All subsequent Redline objects drawn will be added to the Collection until the Redline pane is refreshed and returns to the Default Pane State
Removing Redline Objects from a Redline Collection
One or more Redline Markup objects can be removed from a Collection in a similar manner to which regular Redline Markup objects are deleted.
- Open the Draw and Manage Redline Markups icon from the Main Toolbar.
- On the Manage Redline Objects pane, first select a Redline Layer, and then select a Redline Collection from the drop-down list.
The list of Collections is filtered to only display those Collections associated to the selected Redline Layer.
Fig: Select Redline Layer and Collection - Upon selecting a Collection, the map automatically zooms to the combined extents of all objects within the Collection.
Fig: Map is zoomed to combined extents of all objects within the Collection - Clear all selections by selecting the Clear Selection icon
 on the Enlighten Toolbar.
 - On the map, select one or more Redline Markup objects to remove from the collection using the Remove icon on the Redline Toolbar.
- A confirmation message is displayed where the user must select the OK button before the Redline Markup objects are removed from the collection and deleted.
If the collection being removed is drawn on a redline layer where Notifications have been configured, the following message is displayed
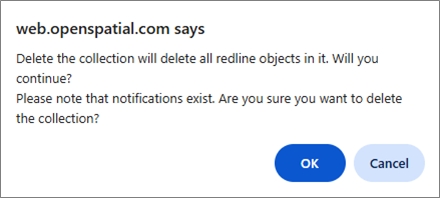
Fig: Confirmation message for Redline Collection drawn on a Layer with Notifications configured
If the collection being removed is drawn on a redline layer where no Notifications have been configured, the following message is displayed
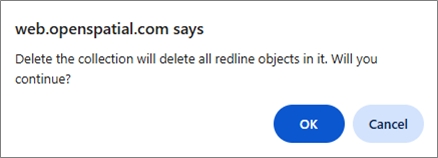
Fig: Confirmation message for Redline Collection drawn on a Layer with no Notifications configured
Editing a Redline Collection Name
The Collection Name can be modified after creation. To change a Collection name do the following:
- Open the Draw and Manage Redline Markups icon from the Main Toolbar.
- On the Manage Redline Objects pane, first select a Redline Layer, and then select a Redline Collection from the drop-down list.
The list of Collections is filtered to only display those Collections associated to the selected Redline Layer.
Fig: Select Redline Layer on which to add the redline objects to - Select the Edit the Collection button next to the Collection Name.
- The Collection text box is editable and the Collection name can be changed.
The name change does not affect the number of objects in the Collection.
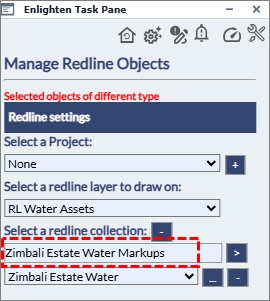
Fig: Edit the Collection Name - Select the ">" button next to the Collection Name to submit the change.
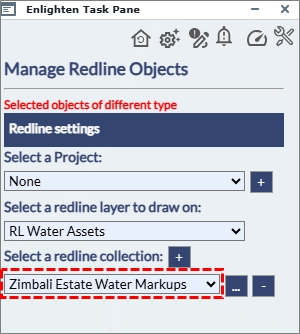
Fig: Collection Name has been updated
Deleting a Redline Collection
A Redline Collection can be deleted by selecting the minus sign "-" next to the Collection name on the Manage Redline Objects pane.
- Open the Draw and Manage Redline Markups icon from the Main Toolbar.
- On the Manage Redline Objects pane, first select a Redline Layer, and then select a Redline Collection from the drop-down list.
The list of Collections is filtered to only display those Collections associated to the selected Redline Layer.
Fig: Select Redline Layer on which to add the redline objects to - Select the minus '-' button next to the Collection Name.
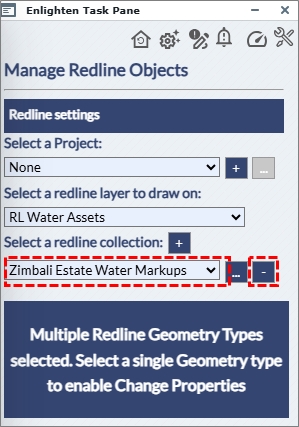
Fig: Select Redline Layer to Delete - If the layer on which the Collection has been drawn has been configured for Notifications, the following confirmation message is displayed where the user must select the OK button before the Redline Collection is deleted.
Note: All Redline Markup objects forming part of the Collection will be deleted.
Fig: Confirmation message before Collection with Notification configured is deleted - If the layer on which the Collection has been drawn has not been configured for Notifications, the following confirmation message is displayed where the user must select the OK button before the Redline Collection is deleted.
Note: All Redline Markup objects forming part of the Collection will be deleted.
Fig: Confirmation message before Collection without Notification configured is deleted
Creating a Redline Project
When creating a new project, users define the project extents by drawing a polygon on the map to specify the project boundary. A project is typically governed by Project Stages which are configurable and represent the current phase in the project life-cycle. For each configurable stage in the project, the redline objects are displayed on separate layers. These stages are updated and maintained by assigned Project Managers as the project advances from preliminary design through to completion.
Access to Redline Layers for the various Project Stages is controlled through User permissions and is configured by an Administrator user. The visibility of each layer or stage is restricted based on the access levels assigned to individual users or user groups, ensuring that only authorized personnel can view or interact with specific project data. Implementing layer-level permissions for different project stages provides several important benefits, particularly when managing sensitive information across teams or departments. Only the Project Administrator can update or delete Projects.
The Layers pane displays the Project Stage layers assigned to the User. In the example below, the user has access to the Feasibility, Preliminary Design and Detailed Design stages.
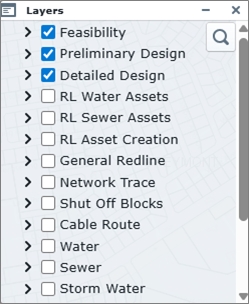
Fig: Layers Pane displaying the Stages the user has access to.
Expanding these Project Stage layers, the Layers pane displays the various Redline Object Types associated to the Project Stages.
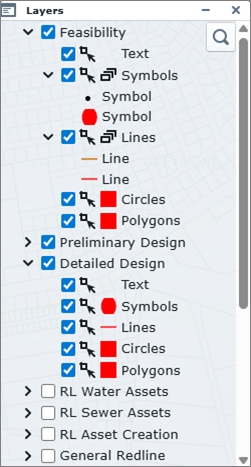
Fig: Layers Pane displaying the expanded Stages layers
To create a new Redline project follow the steps below:
- Select the Draw and Manage Redline Markups icon from the enlighten Main toolbar.
The Manage Redline Objects pane and the Enlighten Redline Toolbar are displayed.
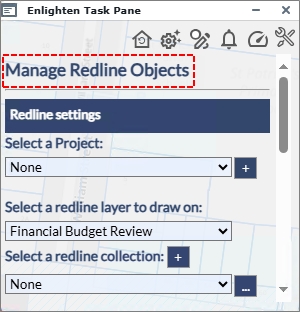
Fig: Manage Redline Objects pane is displayed - Select the plus sign
 adjacent to the blank Project Name.
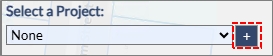
Fig: Select the Plus Sign to create a new Redline Project - The Project details input text boxes are displayed ready for input of the Project Name and Description and the selection of a Project Status and Stage.
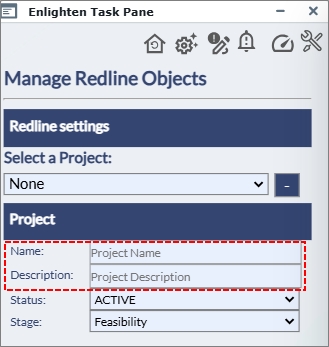
Fig: Redline Project details are displayed - Enter a unique Project Name and Description.
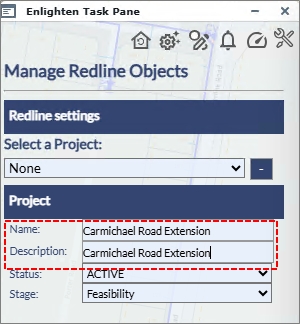
Fig: Enter Redline Project details - Select the Project Status of being either ACTIVE or INACTIVE from the drop-down list, and select the Project Stage from the drop-down list, remembering that the administrator can change the various Stages and the level of user access to these stages.
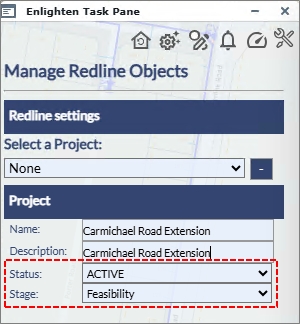
Fig: Select Redline Project Status and Stage from drop-down lists - The Project Name entered must be unique. In the event a duplicate name is entered, the following message is displayed and the user is returned to the Manage Redline Objects pane where they are required to restart the Project creation process.
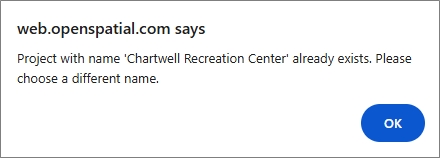
Fig: Message indicating entered Project Name is not unique - Select the Draw option to start tracing the Project Boundary on the map.
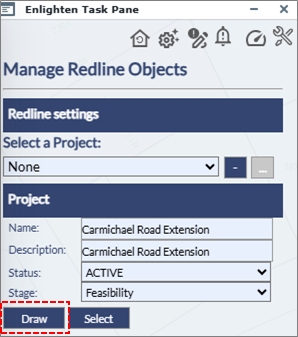
Fig: Select the Draw option - On the enlighten map, you are prompted to Create a Project boundary by tracing points around the area of interest.
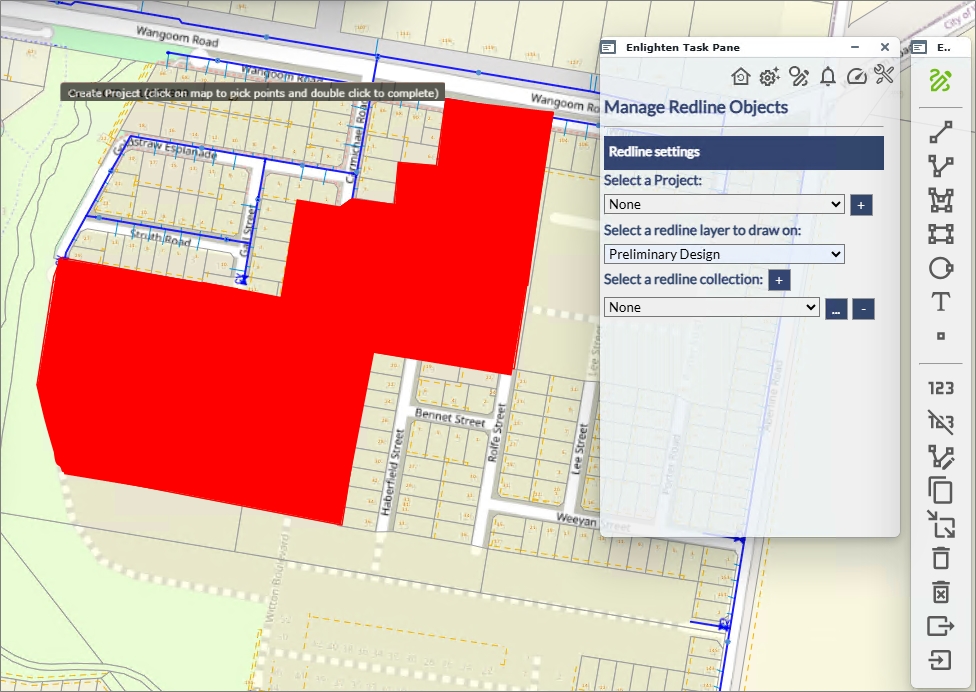
Fig: Create Project Boundary prompt is displayed on the map - Trace a boundary around the area of interest by clicking points on the map, making sure to double-click to close the polygon.
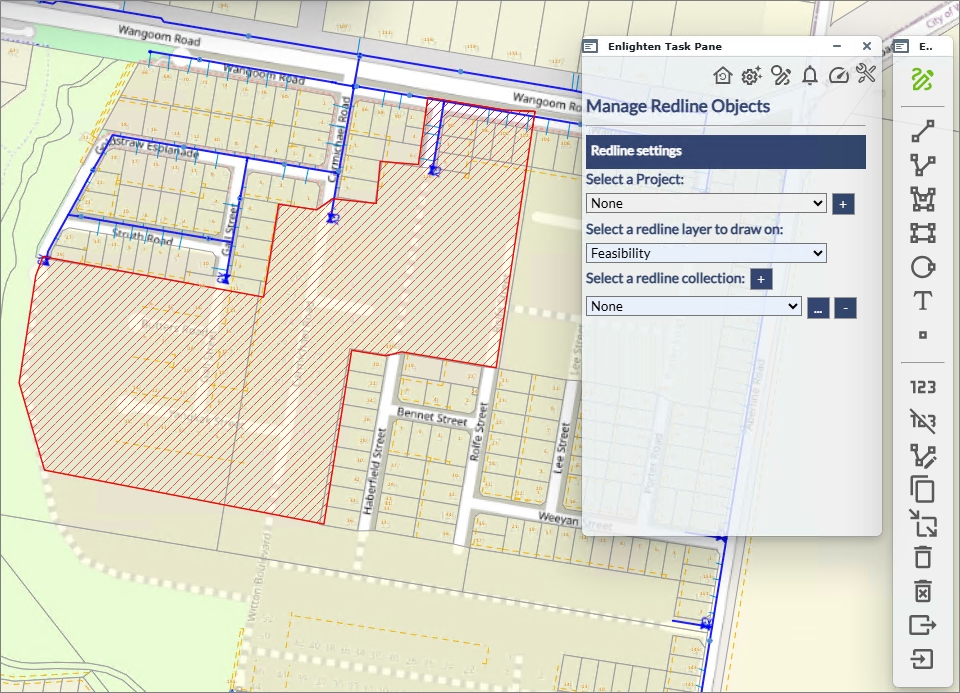
Fig: Trace the project boundary by selecting points on the map - On completion, the Project boundary is created, and is displayed on the Project layer by default, unless otherwise configured.
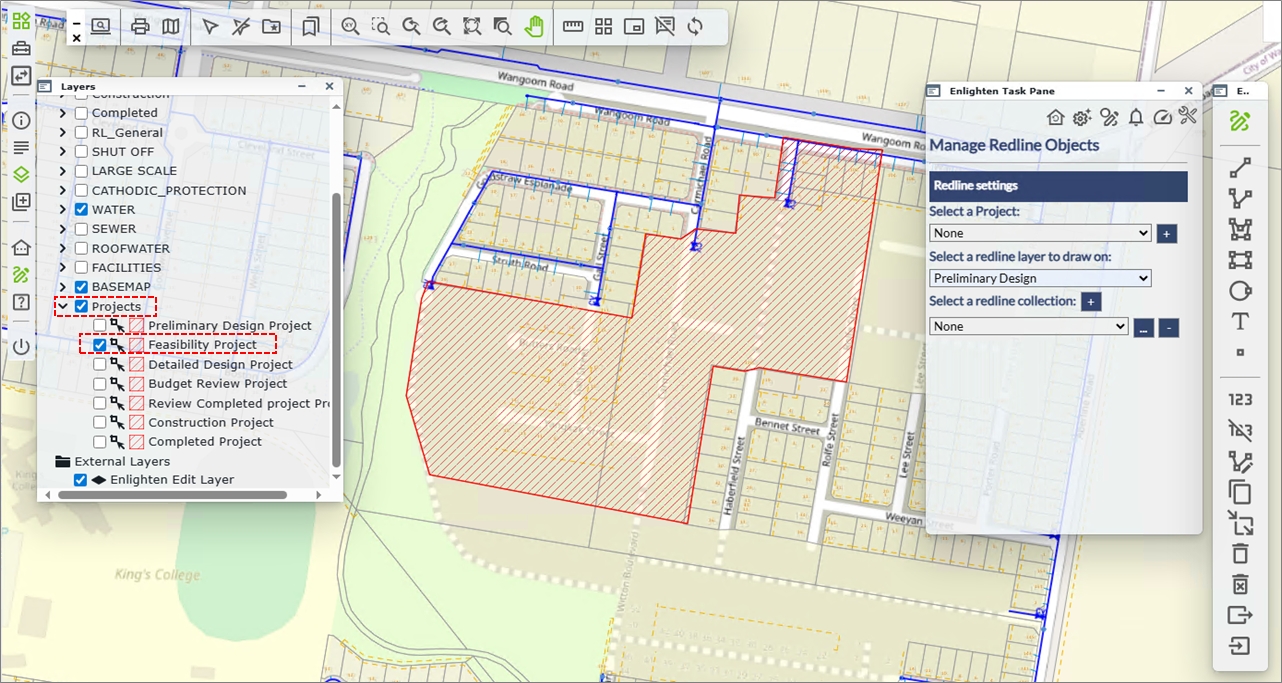
Fig: The Project Boundary is displayed on the Project Layer
Create a New Redline Project Boundary from an existing object.
To create a new Redline project boundary from an existing Map Feature or an existing Redline object that is either a polygon, rectangle or circle object type, do the following:
- From the Main toolbar select the Draw and Manage Redline Markups option .
- The Manage Redline Objects pane opens and Redline Toolbar is displayed in it's default stage.
- Select the Map Feature object or existing Redline object on the map to use as the Project boundary. The selected object must be either a polygon, rectangle or circle object type.
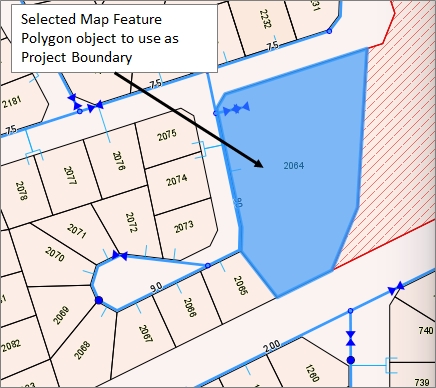
Fig: Select object on the map to use as new Project boundary - On the Manage Redline Object pane for the Project, select the plus sign + to create a new Project.
- Enter the Project Name and Description, and select the Status and Stage from the respective drop-down lists.
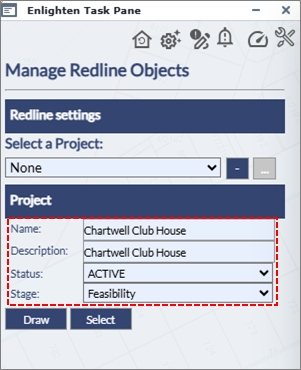
Fig: Complete the Project details - Choose the Select option to generate the Project boundary from the selected map feature object on the map.
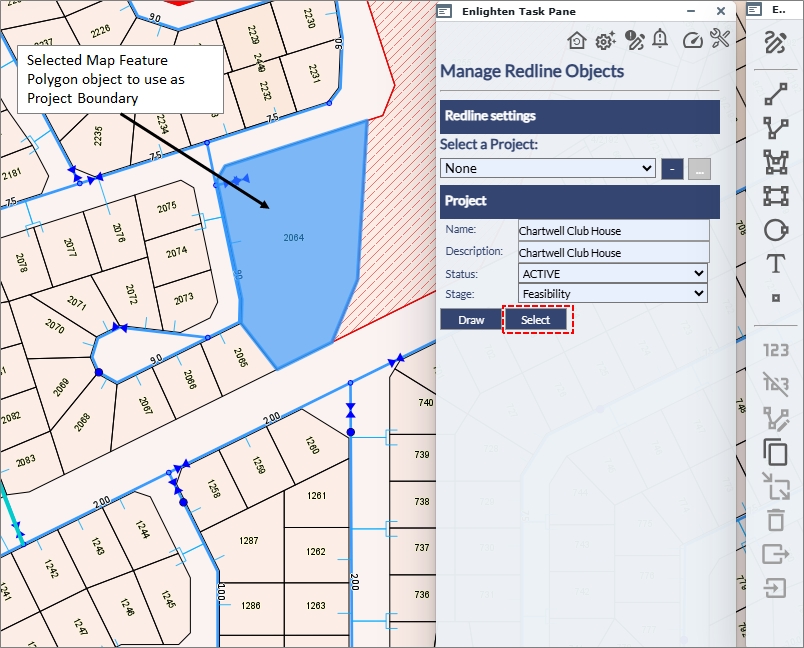
Fig: Choose the Select option - The Project boundary is created and displayed on the Projects stage layer selected.
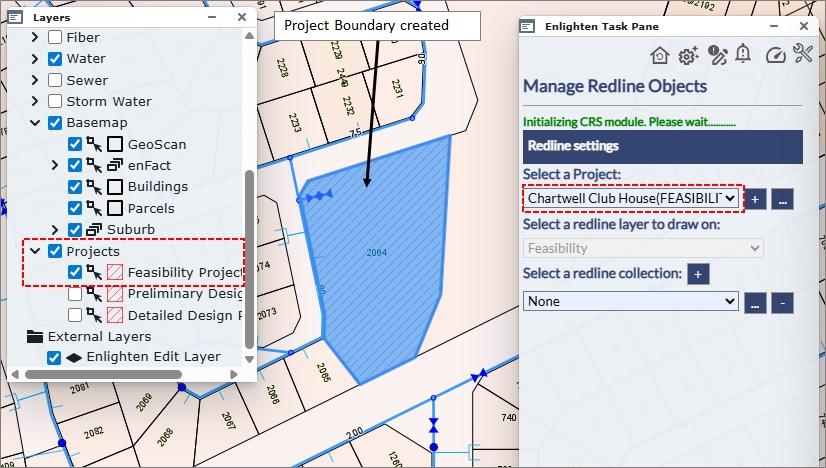
Fig: Project boundary is created from selected object boundary on the map
Editing a Project Boundary on the Map
Users can do basic editing of existing project boundaries by moving existing vertices to different locations on the map. After selecting the Project on the Manage Redline Objects pane, the user is required to enable edit mode before the grip editing tools can be selected to move the boundary vertices. The geometry of the Project boundary is stored in the SP_PROJECTS spatial table, so if more complex editing is required, it is suggested that the geometry be changed using another spatial editing application such as Munsys Spatial Data Manager.
To edit an existing Project boundary on the map, follow the steps below.
- From the Main toolbar select the Draw and Manage Redline Markups option .
- The Manage Redline Objects pane opens and Redline Toolbar is displayed in it's default stage.
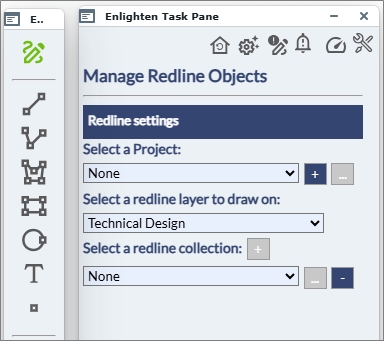
Fig: Manage Redline Object Pane opened - Select the Project to edit from the drop-down list.
The map is zoomed to the extents of the Project boundary.
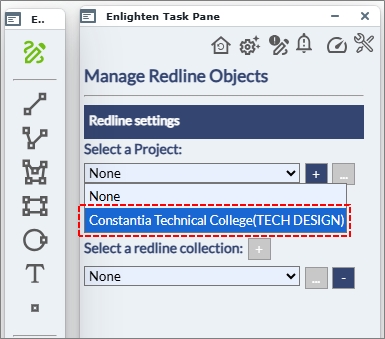
Fig: Select the Project to edit - Select the ellipsoids ... next to the selected Project to enable the editing functionality.
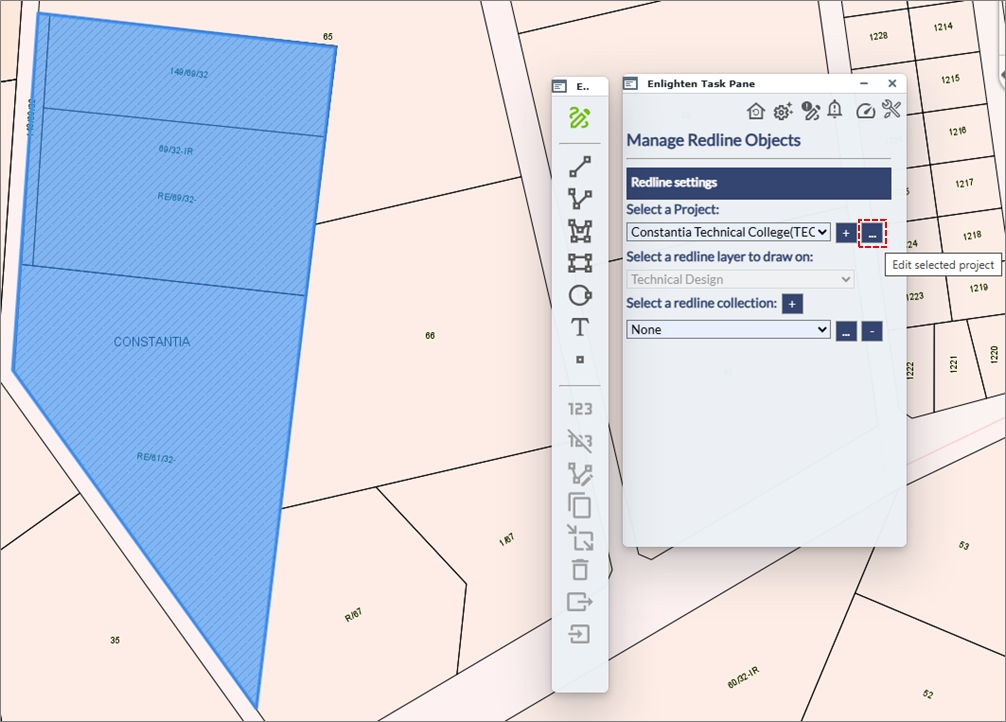
Fig: Enable editing functionality - On the map, move the cursor over to one of the vertices on the project boundary to display the grip editing tools
 .
.
Press and hold the mouse button down while you drag the selected point to the new location.
In the example below, the project boundary is moved from point A to point x.
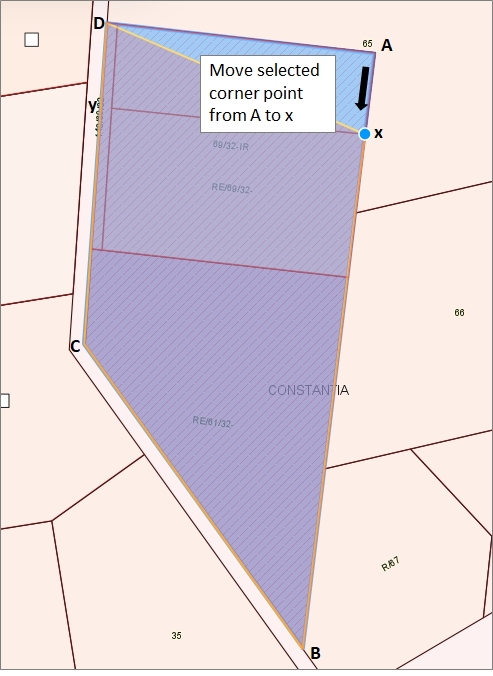
Fig: Move project boundary from point A to point x - In the same example, the Project boundary is also moved from point D to point y.
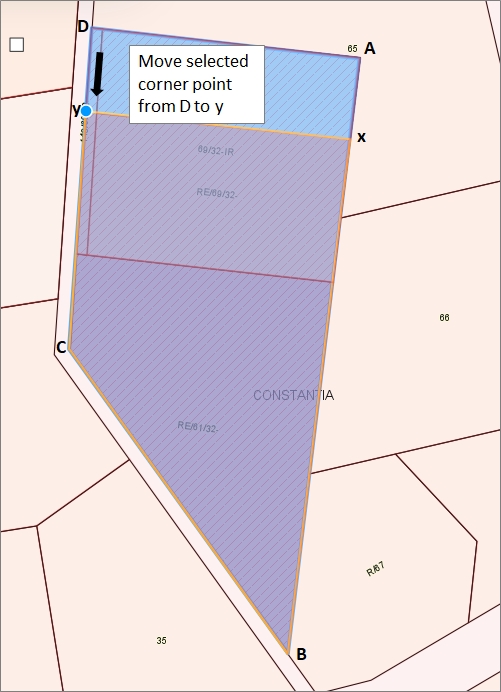
Fig: Move project boundary from point D to point y - Select the Apply button to complete the editing.
The project boundary is automatically redrawn to the new boundary extents.
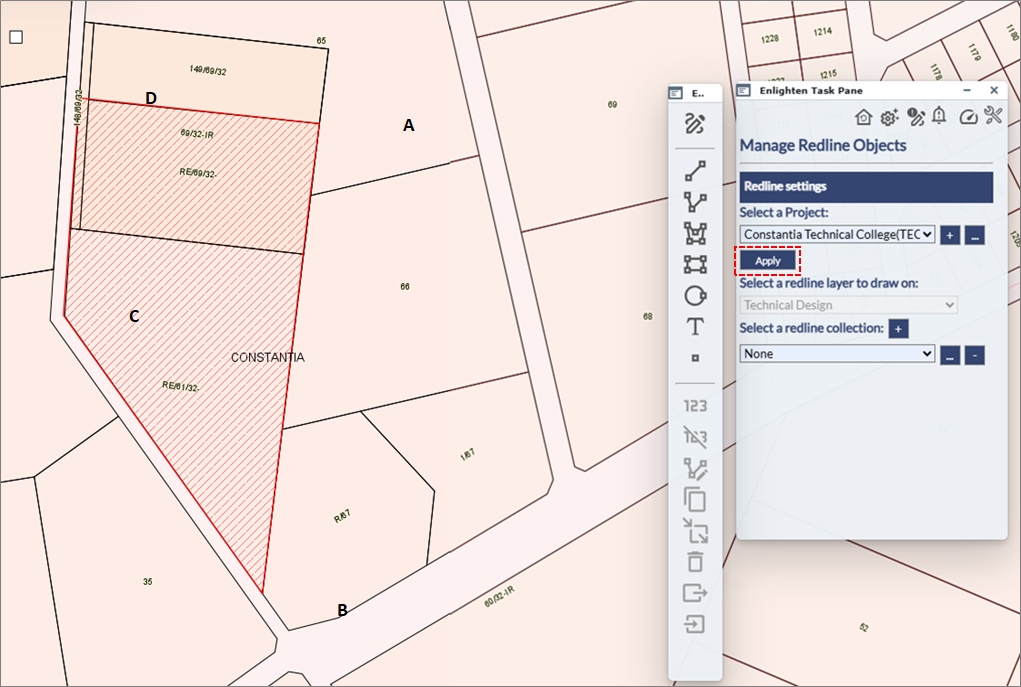
Fig: Apply the editing changes where the modified project extents are displayed
Viewing Project Stages on the Map
Users can view project boundaries at various stages by selecting a Project Stage from the drop-down list in the Redline Pane. The Stage drop-down list only displays the stages that the user has permission to view. When a specific project stage is selected, the corresponding redline project boundary is displayed on the Enlighten map. As users navigate through different Projects, the map will update the display.
To view the project boundaries at their different stages, do the following.
- From the Main toolbar select the Draw and Manage Redline Markups option .
- The Manage Redline Objects pane opens and Redline Toolbar is displayed in it's default stage.
- The Project drop-down list only displays the Projects for the Stages the user has been assigned permissions to.
Each project has the Stage displayed in caps within brackets.
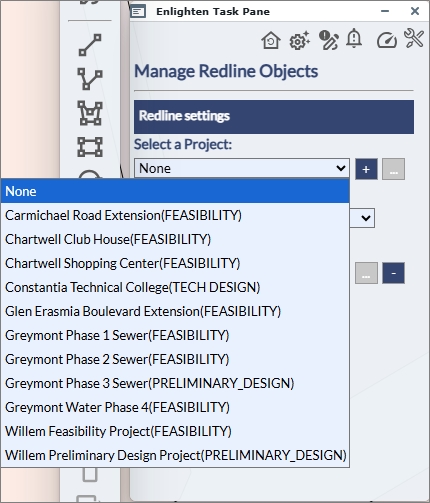
Fig: List of Projects with the Stage displayed in brackets - Select one of the Projects from the drop-down list, for example Chartwell Club House(FEASIBILITY).
The map is automatically zoomed to the extents of the Project boundary, and the boundary polygon is displayed on the Projects layer.
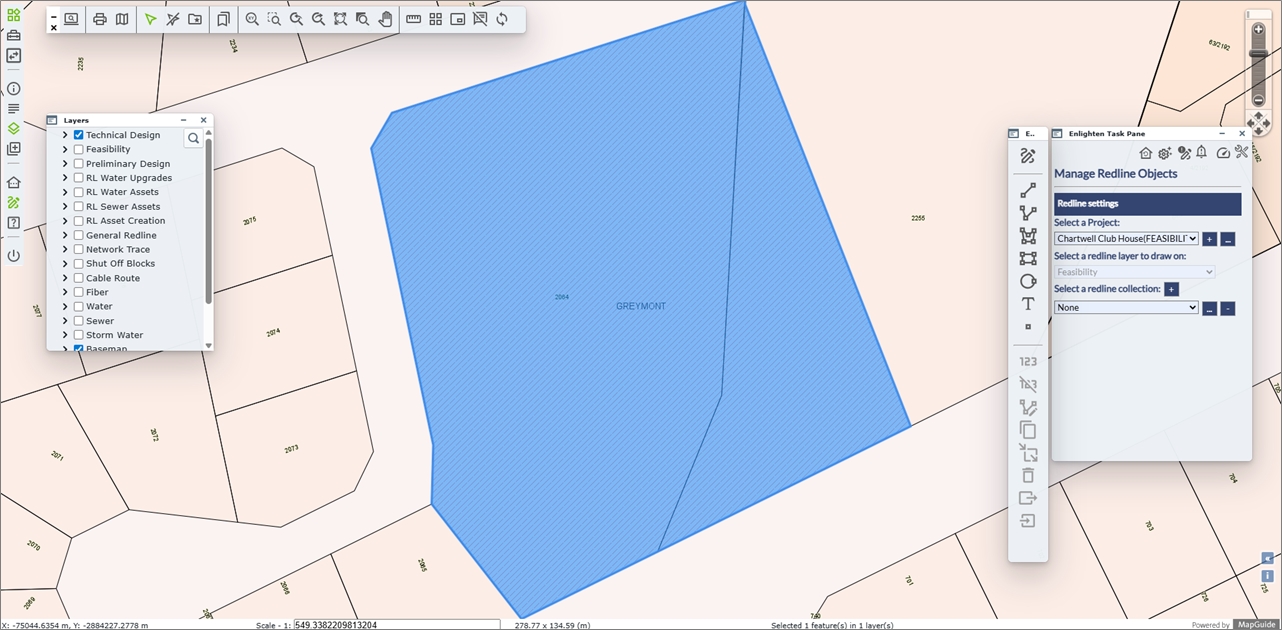
Fig: Map is automatically zoomed to the extents of the selected Project boundary - The Stage to which the Project is assigned is locked on the Redline pane and can only be updated by the Project Administrator whose job it is to promte the project through the various project stages.
Redline Notifications
When the Redline Notifications icon is selected ![]() it allows the user to add a Description, Type and Status to the relevant redline object selected. Each change which occurs in the Redline Notifications Pane will be recorded within the Edit History window.
it allows the user to add a Description, Type and Status to the relevant redline object selected. Each change which occurs in the Redline Notifications Pane will be recorded within the Edit History window.
Redline Notifications allows users the opportunity to place notifications on redline layers. The users now have the option to place a notification on designated users or groups, for any changes made on a specific redline layer. The notification allows user groups/users to be informed of any changes which are made to that specific redline layer. However, for this to be possible, the redline layer must be assigned to the user who wishes to receive the notifications.
If the Redline Notifications icon displays an exclamation symbol in the top left corner ![]() , this indicates to the user that changes have been made on a Redline layer on which they have been configured to receive Redline Notifications.
, this indicates to the user that changes have been made on a Redline layer on which they have been configured to receive Redline Notifications.
To Edit a Redline object the user would need to follow the steps listed below:
- Click on the desired redline object, to select it for Editing. When the user selects the redline layer for editing, the following fields would be auto-populated:
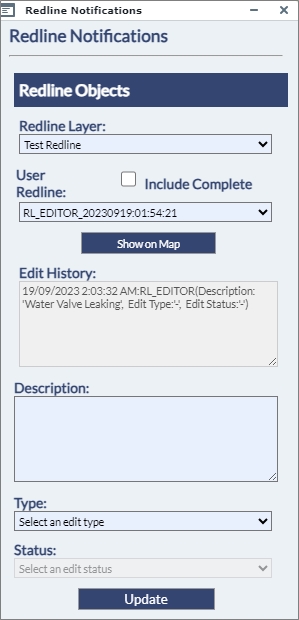
Fig: Blank Redline Notification pane- Redline Layer: This is derived from the layer in which the redline object is created within.
- User Redline: This is a value that gets automatically populated by a database sequence.
- Include Complete (check box): Redline markups whose Status is set to Complete will not be displayed as a redline object in the User Redline list unless the Include Complete check box is ticked.
- Show on Map: If the user has selected a redline segment from the User Redline list, selecting the Show on Map option zoom to the selected object extents on the map.
- Edit History: This window records the changes made on a specific redline object.
- Next the user would be prompted to enter in an appropriate Description of the redline object. The user should enter a meaningful description as to the reason for the edit, for example: Water Valve replaced by Maintenance Team.
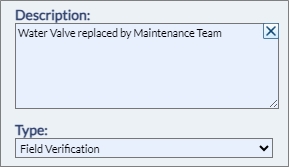
Fig: Redline Notification Edit Description - The user can then select the Type from the drop-down list. There are two options:
- Field Verification: This is data which has been verified on-site by staff and is to be captured.
- New Data Capture: This refers to new data which is being captured.
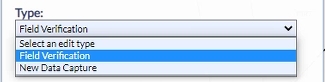
Fig: Redline Type - Click on the drop-down arrow in the Status section and there would be a choice of five options:
- Change Applied: This indicates that the changes have been applied.
- Change Rejected: This indicates that the changes have been rejected.
- Complete: This indicates that the changes are completed and no further updates are required on the Redline object.
- Logged: This indicates that the redline objects have been logged onto the system.
- Verified: This indicates that the redline objects have been verified.
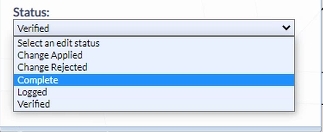
Fig: Redline Status - Once completed the user can then click on the Update button, to save the changes. The wording Updating redline edit…… is displayed while the update is in progress. Once the update is completed, the wording Done.
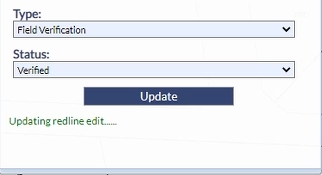
Fig: Redline edit update in progress - The Edit History reflects the edits made.
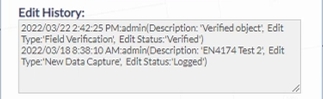
Fig: Redline Edit History - Once the Redline Object does not require any further verification or edits, the user should do a final update to change the redline Status to Complete. Once this update has been applied, the tick box for the Include Complete must be checked
 to permit completed redline objects to be displayed in the User Redline list.
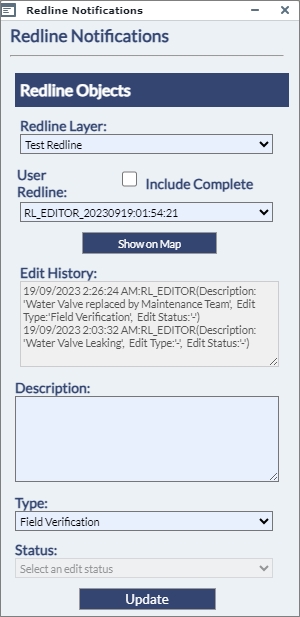
Fig: Redline Notification Include Complete check-boxNote: Based on the new Map configuration setting, Completed redline objects will not be displayed on the redline layer on the map if the Redline Complete filter has been applied by the administrator. If the user selects a redline object whose status is set to Complete, and attempts to use the Show on Map function to zoom to the completed redline object, the following message will be displayed. 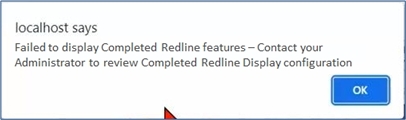
Fig: Completed Redline objects failure to display message - The user should contact their enlighten Administrator to check the Redline Display configuration. Further information on how to setup Notifications can be found in the enlighten Administrators guide, in the Map Admin section of Redline Layers, under the Notification Alerts sub-heading.
Redline Notifications on Show Info Pane
When selecting a Redline object/s on the map and selecting the Show Info icon ![]() , users can view general information about the Redline object/s, information about Redline Notifications for the selected object/s, as well as historical information on all Redline Edits for the selected object/s.
, users can view general information about the Redline object/s, information about Redline Notifications for the selected object/s, as well as historical information on all Redline Edits for the selected object/s.
Refer to the Show Info section for information on the Tree View, List View and Detail view in the Show Info pane, how to export information, and how to view and manage large amounts of information.
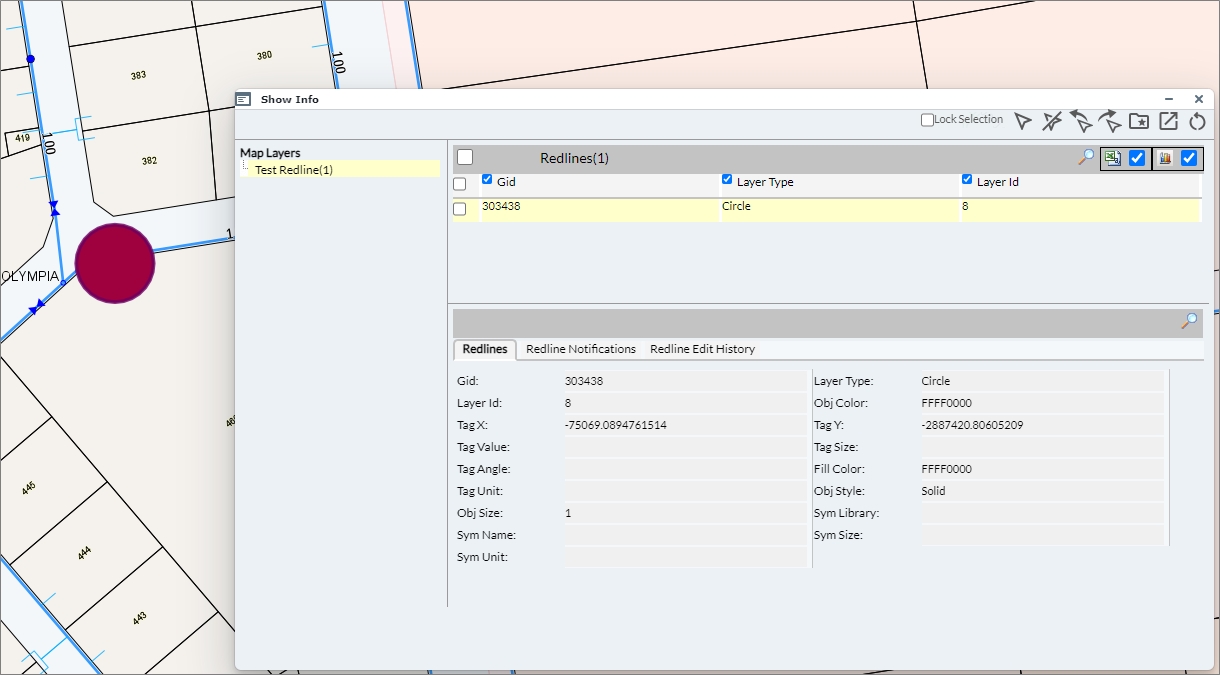
Fig: Show Info Redlines tab
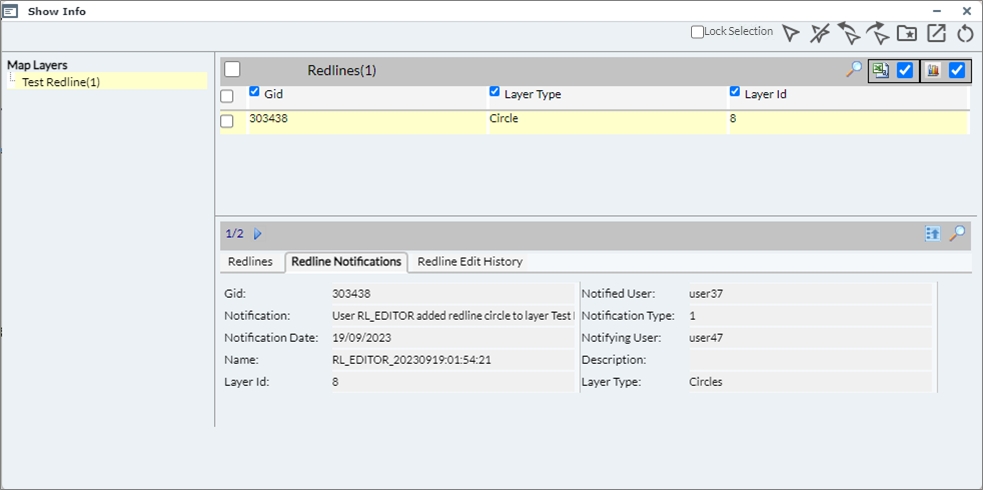
Fig: Show Info Redline Notifications tab
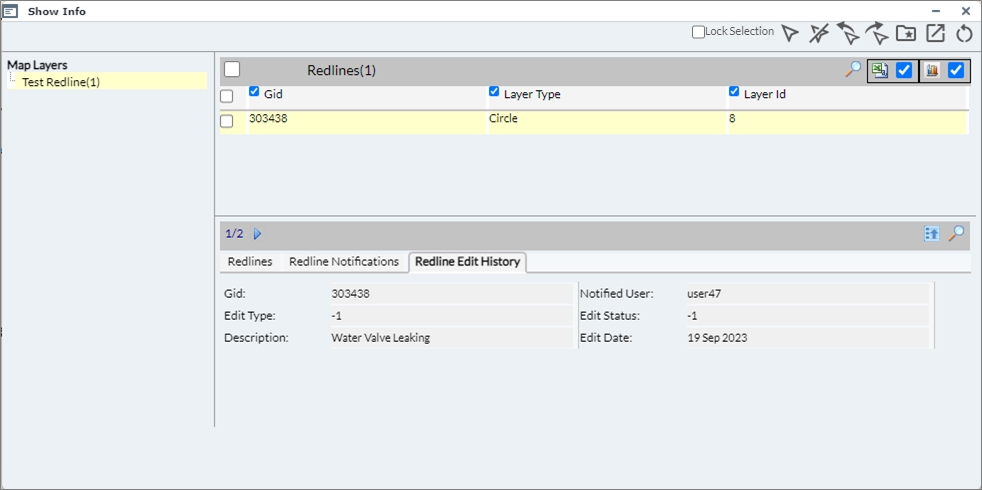
Fig: Show Info Redline Edit History tab
Clear Redline Notifications input fields on Mobile Device
When users access enlighten from within a mobile device, then it becomes difficult to input and clear the input on text fields. As a solution to this, a distinct X button was added to allow the user to clear input by pushing one button, as opposed to hitting backspace multiple times.
This feature also makes it easier for the desktop user to quickly remove information from the input field, saving time and increasing efficiency.
The example below references Redline Notifications, and the X button is available for the user to clear the Name field and Description for the redline layer called Verified_Redlines and redline object Davendren_20190630:22:25:14.
![]()
Fig: Clear selection for Redline Objects